Fig. 9.
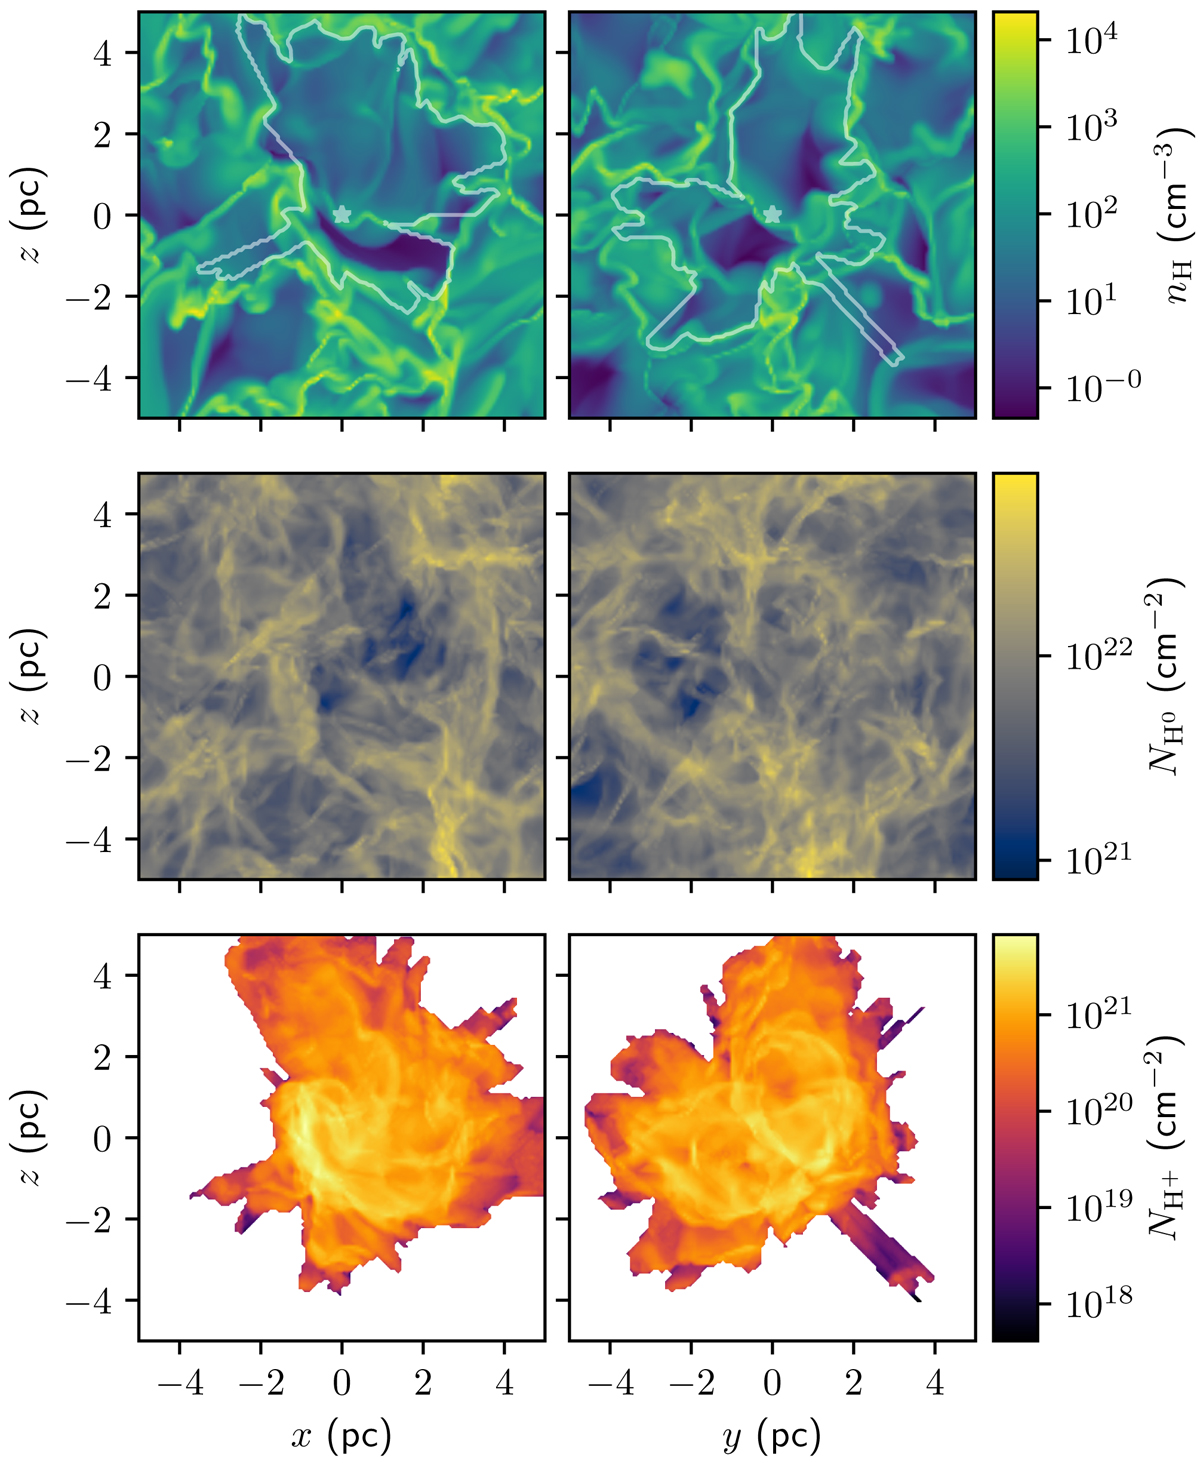
Strömgren volume in a turbulent medium. The columns correspond to different viewing angles: along the y-axis (left), and along the x-axis (right). Top row: density in a planar cut through the centre of the box. The white star indicates the position of the ionizing source. The white contour shows the ionization front, defined as the radius where the neutral fraction rises above 0.5. Middle row: surface density of the neutral gas. Bottom row: surface density of the ionized gas. White patches correspond to sight lines along which all the gas is neutral.
Current usage metrics show cumulative count of Article Views (full-text article views including HTML views, PDF and ePub downloads, according to the available data) and Abstracts Views on Vision4Press platform.
Data correspond to usage on the plateform after 2015. The current usage metrics is available 48-96 hours after online publication and is updated daily on week days.
Initial download of the metrics may take a while.