Fig. 21.
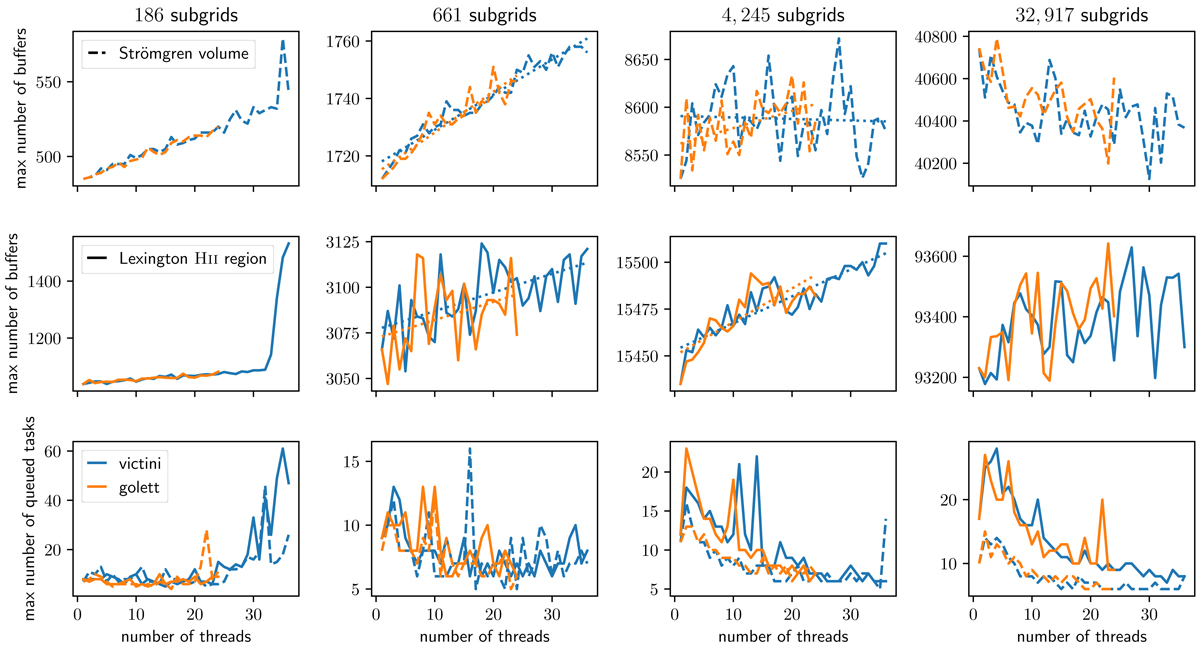
Maximum number of active buffers for the Strömgren (top) and Lexington (middle) tests, and maximum number of queued tasks in any per-thread queue (bottom) as a function of number of threads for the two different clusters. The columns correspond to the four tests with different subgrid sizes shown in Fig. 14. The dotted lines in the central panels indicate a linear fit to the corresponding curves.
Current usage metrics show cumulative count of Article Views (full-text article views including HTML views, PDF and ePub downloads, according to the available data) and Abstracts Views on Vision4Press platform.
Data correspond to usage on the plateform after 2015. The current usage metrics is available 48-96 hours after online publication and is updated daily on week days.
Initial download of the metrics may take a while.