Fig. 18.
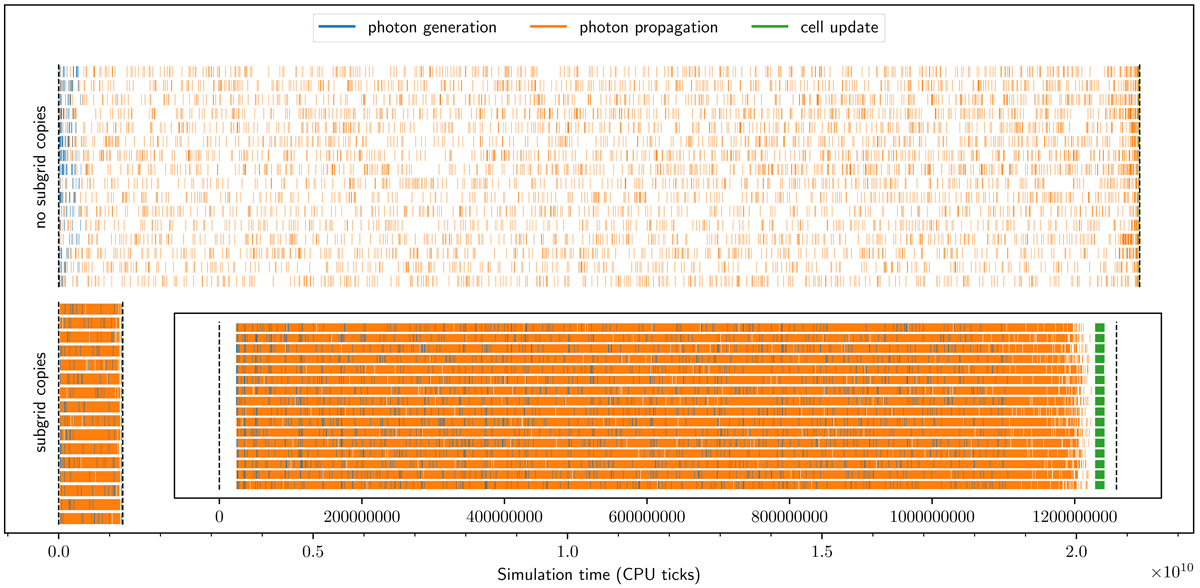
Task execution time line for a 16-thread run with and without subgrid copies. Each horizontal line corresponds to a single thread. The colours correspond to the different tasks that are being executed by the thread, as indicated in the legend. White segments correspond to idle time. The dashed lines at the start and end correspond to the start and end of the iteration. The inset shows a zoom for the run with subgrid copies.
Current usage metrics show cumulative count of Article Views (full-text article views including HTML views, PDF and ePub downloads, according to the available data) and Abstracts Views on Vision4Press platform.
Data correspond to usage on the plateform after 2015. The current usage metrics is available 48-96 hours after online publication and is updated daily on week days.
Initial download of the metrics may take a while.