Fig. 14.
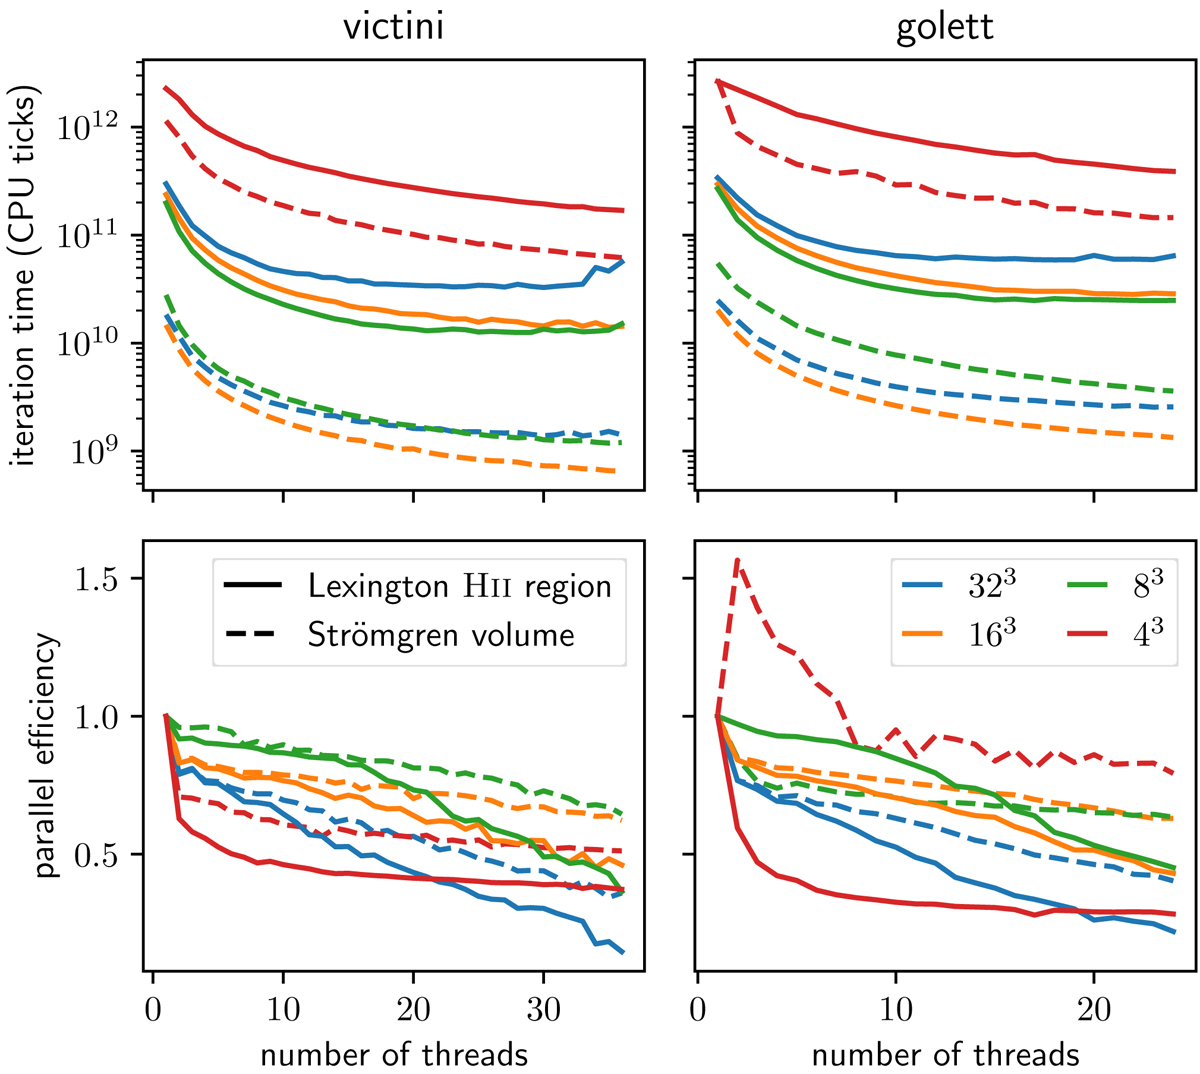
Total run time (top) and parallel efficiency (bottom) for a single iteration of the Strömgren and Lexington tests as a function of the number of shared memory threads used to execute the test. The columns show the results for two different clusters, while the colours correspond to different subgrid sizes, as indicated in the legend.
Current usage metrics show cumulative count of Article Views (full-text article views including HTML views, PDF and ePub downloads, according to the available data) and Abstracts Views on Vision4Press platform.
Data correspond to usage on the plateform after 2015. The current usage metrics is available 48-96 hours after online publication and is updated daily on week days.
Initial download of the metrics may take a while.