Fig. 13.
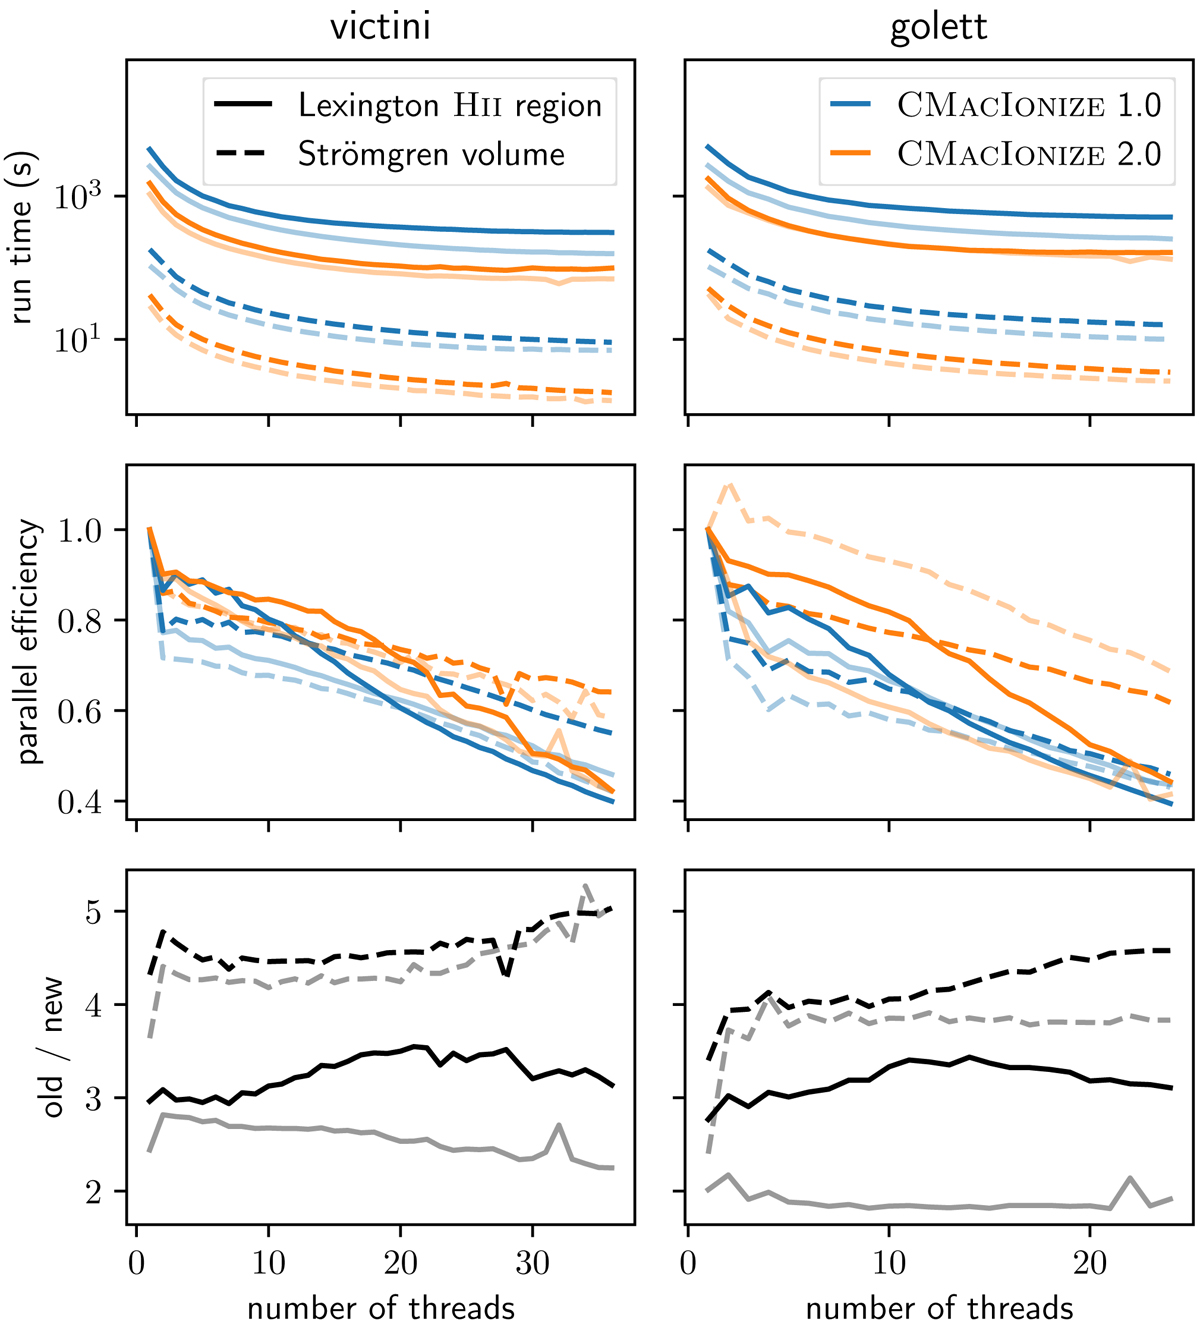
Total run time (top), parallel efficiency (middle), and algorithmic speedup (bottom) for the Strömgren and Lexington tests, ran with two versions of CMACIONIZE using the same initial condition. The algorithmic speedup is computed by dividing the run time for the CMACIONIZE 1.0 version by that for the CMACIONIZE 2.0 version. The columns correspond to results for two different clusters. The dark lines correspond to the tests that used a uniform density structure, while the lighter lines are the same test in a turbulent density structure.
Current usage metrics show cumulative count of Article Views (full-text article views including HTML views, PDF and ePub downloads, according to the available data) and Abstracts Views on Vision4Press platform.
Data correspond to usage on the plateform after 2015. The current usage metrics is available 48-96 hours after online publication and is updated daily on week days.
Initial download of the metrics may take a while.