Fig. 12.
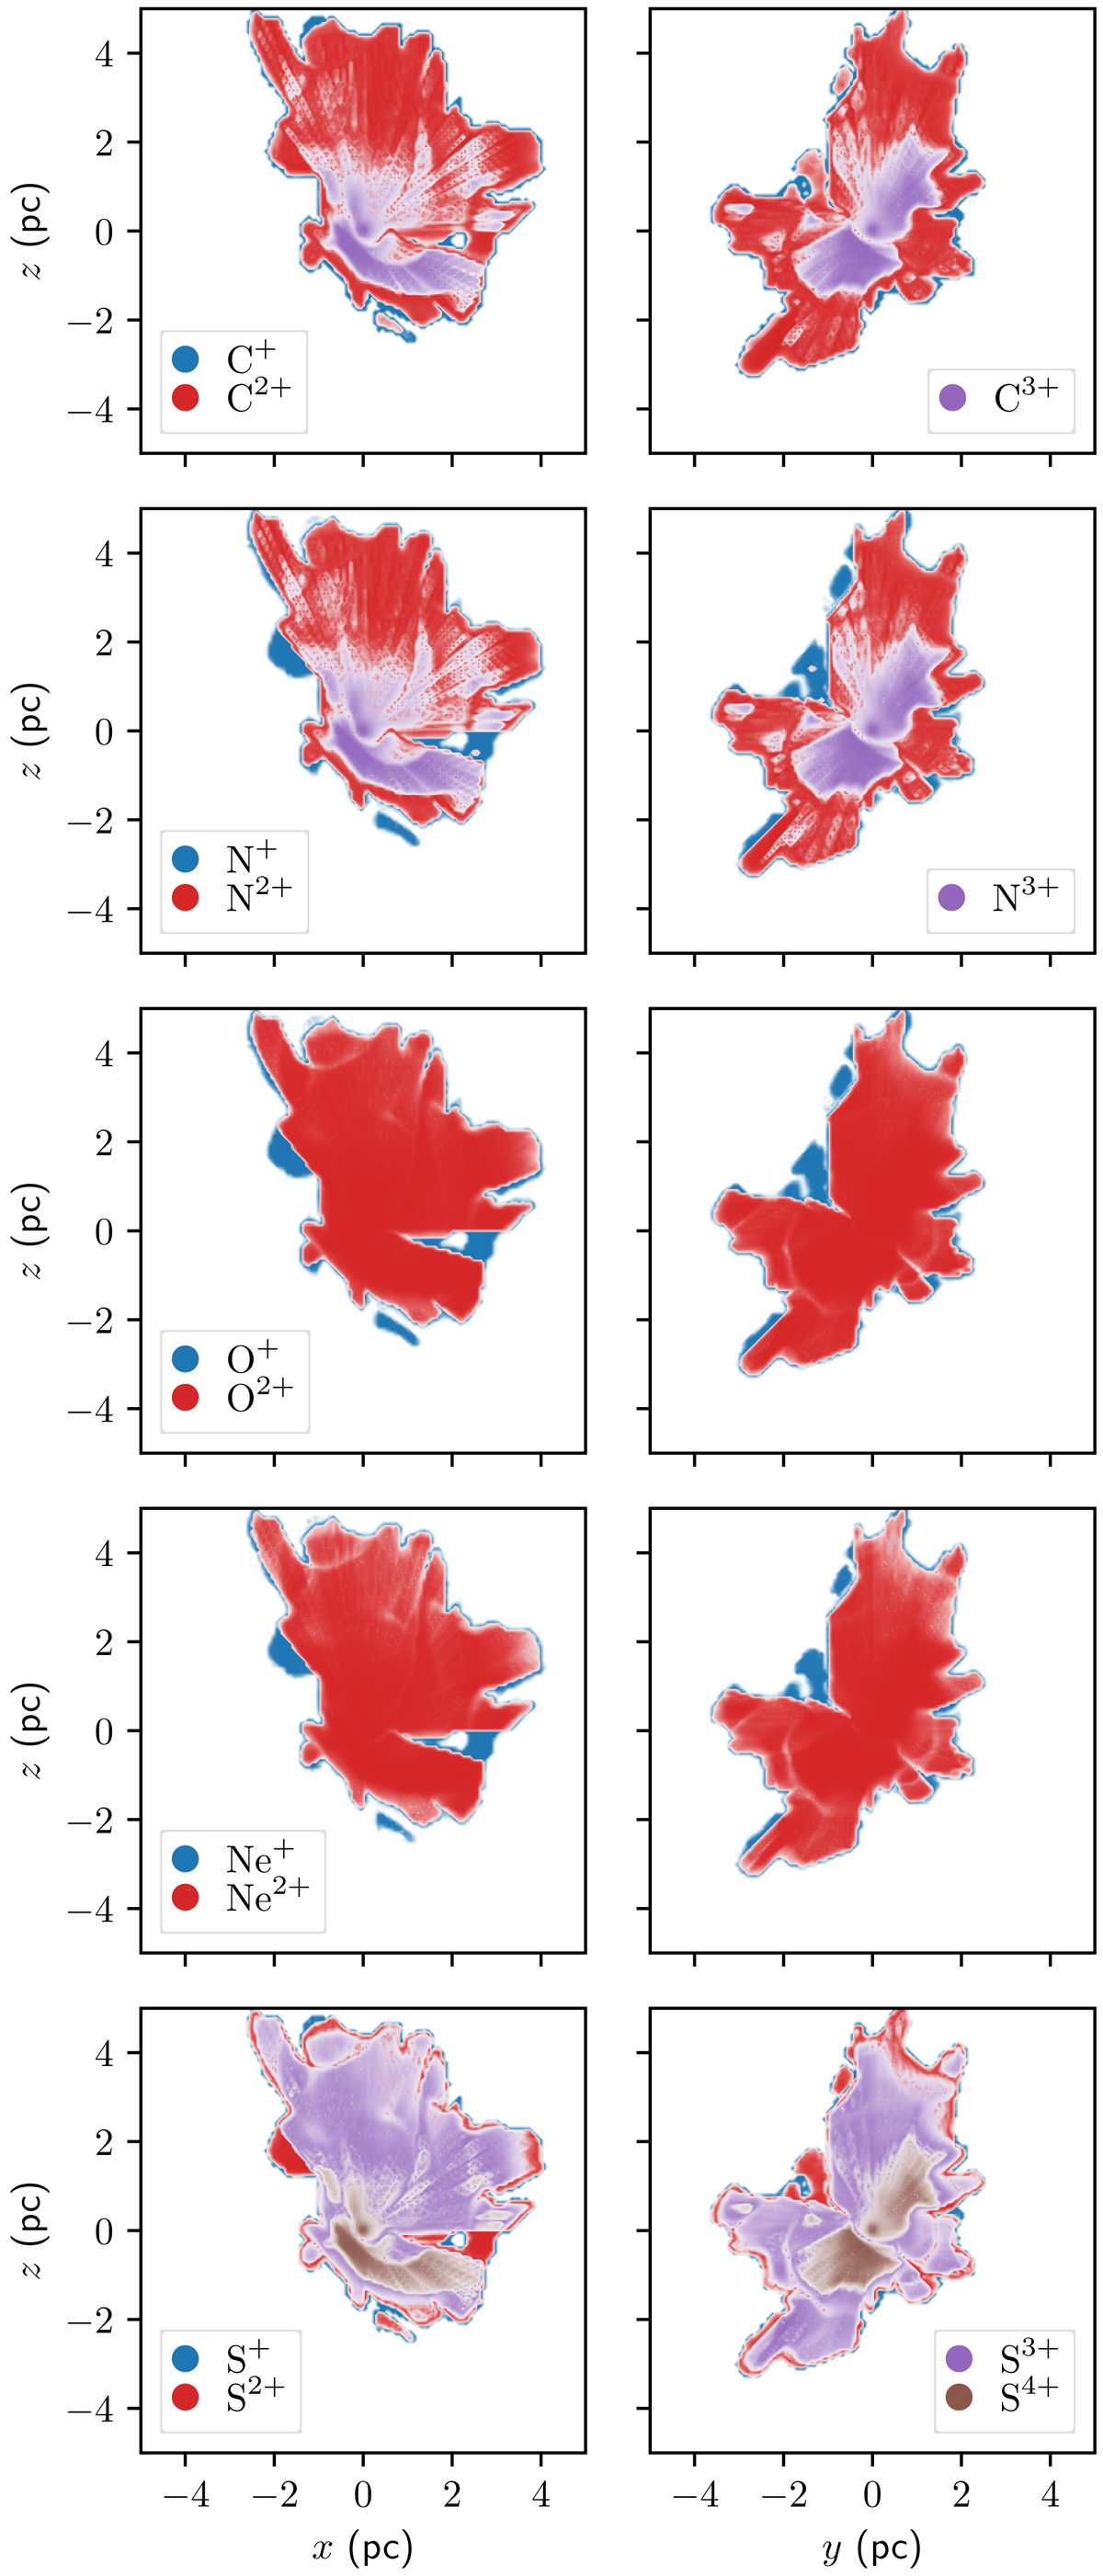
Ionic fractions of various ions in slices through the turbulent high-temperature Lexington test. The two panels show slices perpendicular to the y-axis (left) and perpendicular to the x-axis (right). The opacity of the colours linearly scales with the ionic fraction of the corresponding ion. The ionic fractions outside the H II regions are not accurately tracked by our method and are therefore not displayed.
Current usage metrics show cumulative count of Article Views (full-text article views including HTML views, PDF and ePub downloads, according to the available data) and Abstracts Views on Vision4Press platform.
Data correspond to usage on the plateform after 2015. The current usage metrics is available 48-96 hours after online publication and is updated daily on week days.
Initial download of the metrics may take a while.