Fig. 11.
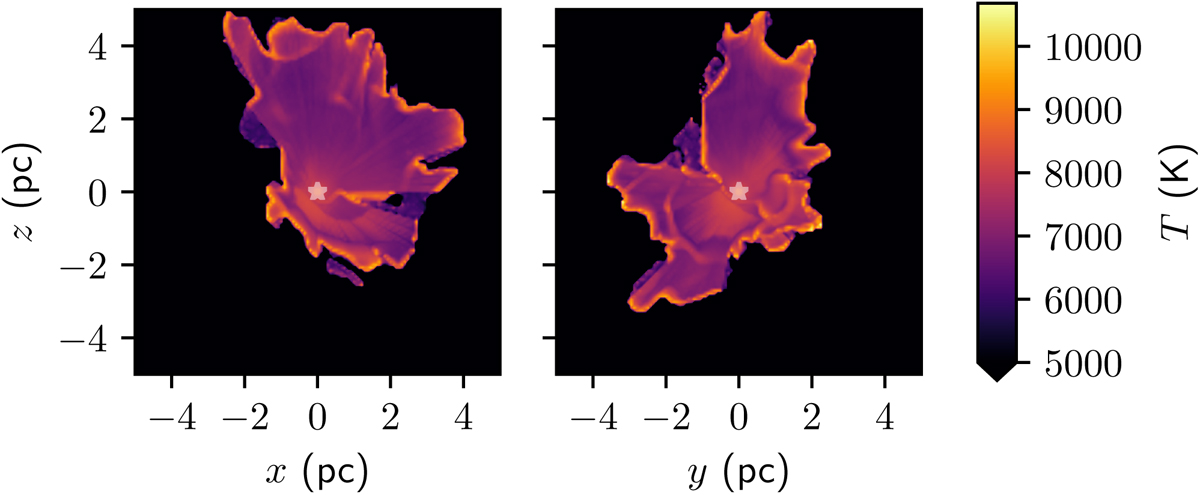
Temperature slices through the turbulent high-temperature Lexington test. The two panels show slices perpendicular to the y-axis (left) and perpendicular to the x-axis (right). The white star indicates the position of the ionizing source. The temperature outside the H II region is set to a fixed value of 500 K and is therefore not included in the temperature scale.
Current usage metrics show cumulative count of Article Views (full-text article views including HTML views, PDF and ePub downloads, according to the available data) and Abstracts Views on Vision4Press platform.
Data correspond to usage on the plateform after 2015. The current usage metrics is available 48-96 hours after online publication and is updated daily on week days.
Initial download of the metrics may take a while.