Fig. 8.
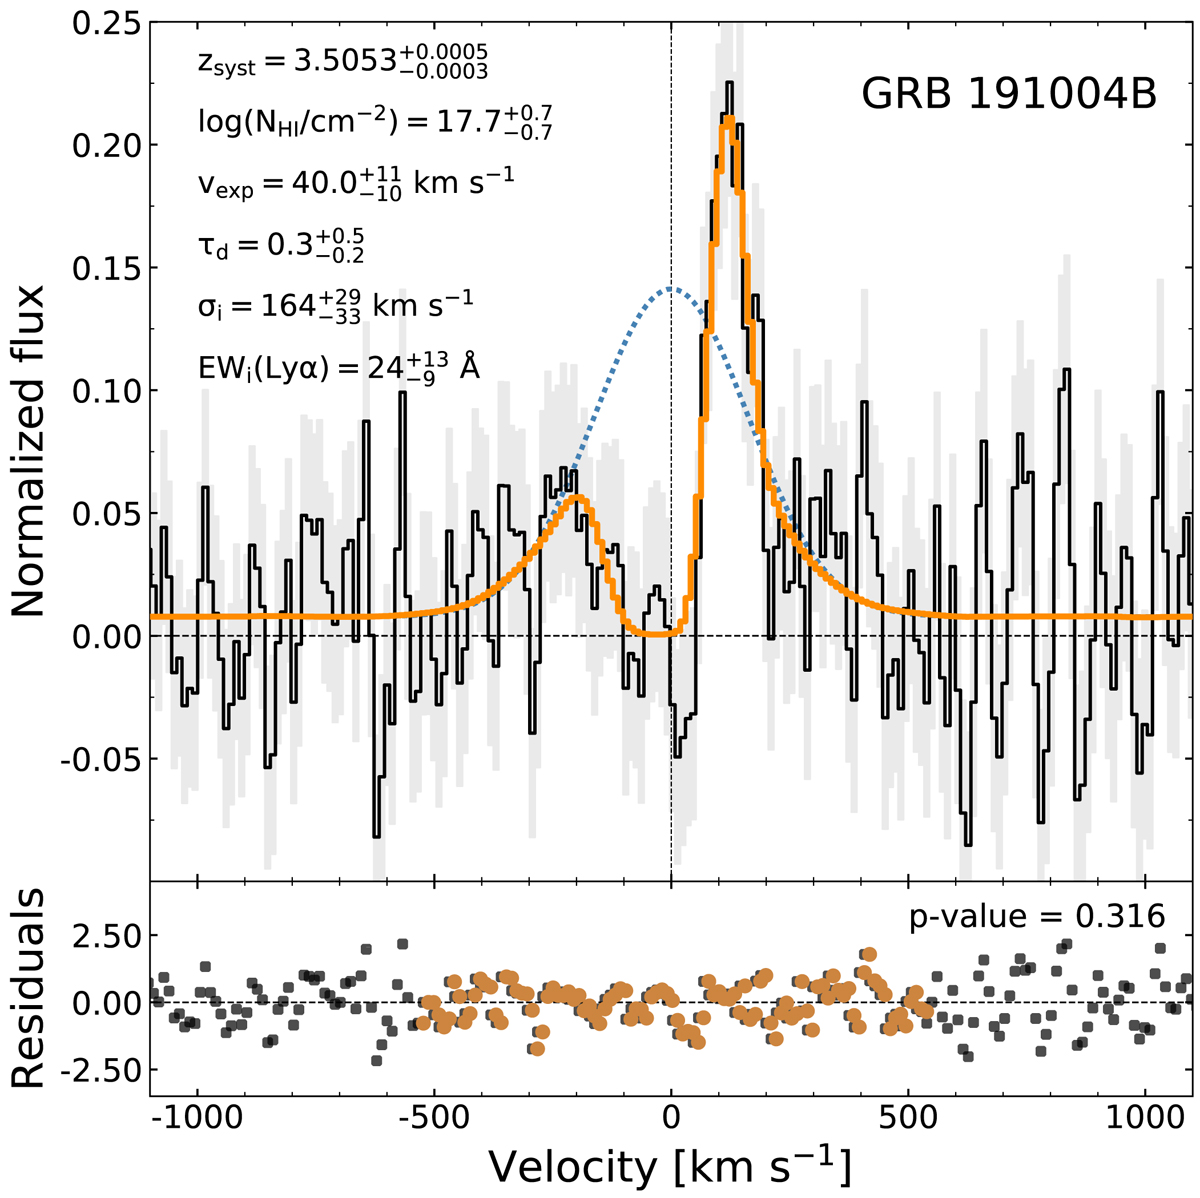
Best fit of the GRB 191004B Lyα line, observed in the X-shooter host-galaxy spectrum, with unconstrained shell models. Top panel: the solid black line corresponds to the data with their error bars (grey), in dashed orange the best fit and in dotted blue the intrinsic Lyα emission predicted by the model. In the top left corner, we show the best-fit parameters. Bottom panel: the dots correspond to the normalized residuals between the observation and the model. The orange ones are for the Lyα profile only with the corresponding p-value for the Shapiro-Wilk test.
Current usage metrics show cumulative count of Article Views (full-text article views including HTML views, PDF and ePub downloads, according to the available data) and Abstracts Views on Vision4Press platform.
Data correspond to usage on the plateform after 2015. The current usage metrics is available 48-96 hours after online publication and is updated daily on week days.
Initial download of the metrics may take a while.