Fig. 7.
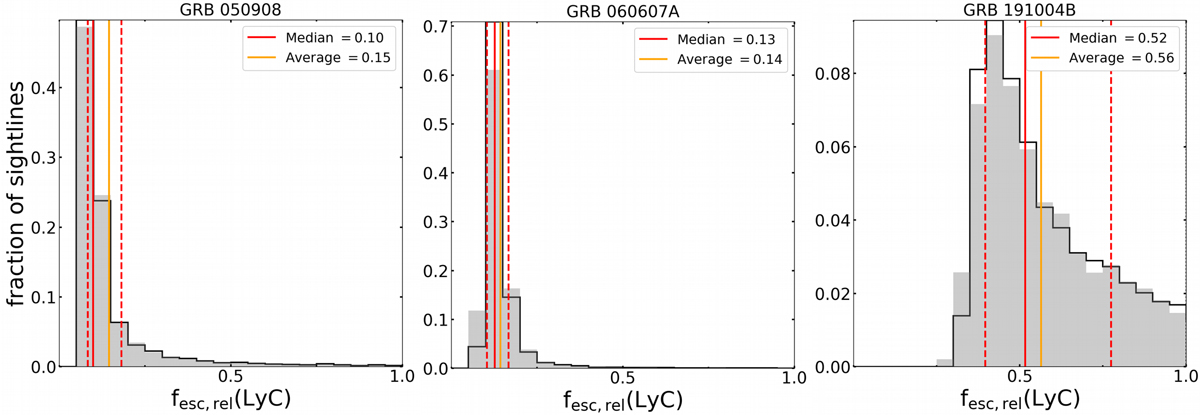
Distribution of relative escape fraction (fesc, rel(LyC)) for GRB 050908, GRB 060607A and GRB 191004B (from left to right) with and without uncertainty on the observed measure of (f1500/f900)obs from the afterglow spectrum (respectively gray and black distribution). The high values with fesc, rel(LyC) > 1 are non-physical and due to low IGM transmission, hence we restrict the statistics and axis range to 0−1 for fesc, rel(LyC). For GRB 191004B, 57% of the gray distribution is at fesc, rel(LyC)≤1 while the fraction is 92% and 96% for GRB 050908 and GRB 060607A, respectively. The solid red and orange lines in each panel represent the median and average value of this fesc, rel(LyC)≤1 part of the distribution. The dashed red lines represent the corresponding 16th and 84th percentiles. The fesc, abs are similar to the values quoted here for GRB 050908 due to the null extinction hypothesis. For GRB 191004B and GRB 060607A the corresponding absolute values are derived in Sects. 4.2 and 5.
Current usage metrics show cumulative count of Article Views (full-text article views including HTML views, PDF and ePub downloads, according to the available data) and Abstracts Views on Vision4Press platform.
Data correspond to usage on the plateform after 2015. The current usage metrics is available 48-96 hours after online publication and is updated daily on week days.
Initial download of the metrics may take a while.