Fig. 6.
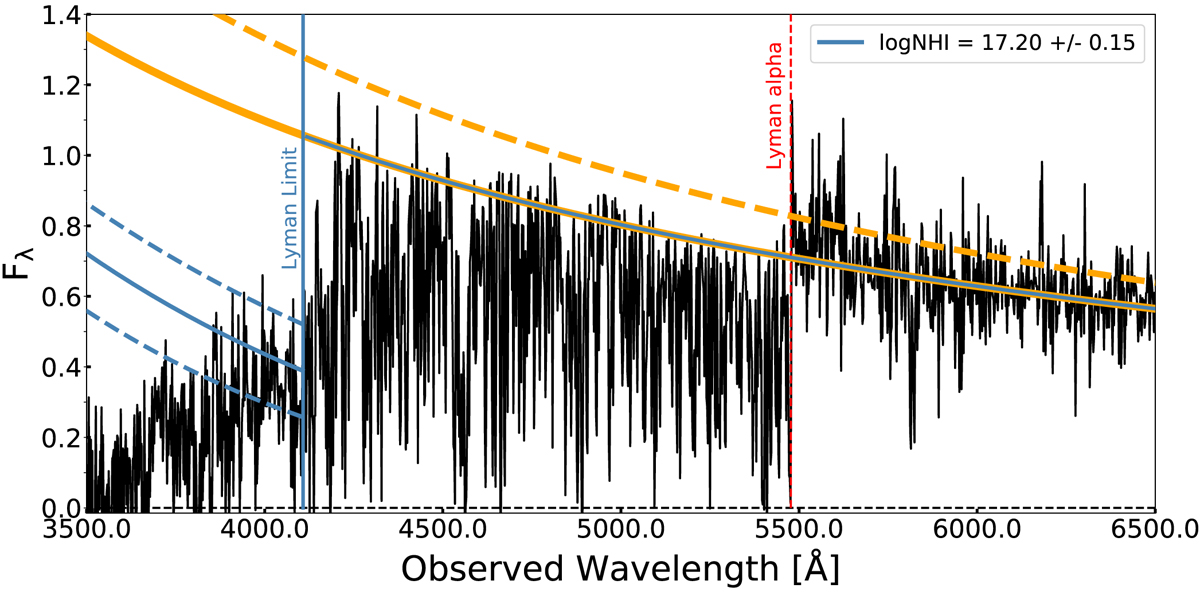
Afterglow spectrum of the GRB 191004B covering the LL and Lyα line. The flux of the escaping LyC photons obtained for log(NH I/cm−2) = 17.20±0.15 corresponds to the blue solid and dashed lines below the LL. The orange solid (dashed) line corresponds to the fit of the afterglow continuum without (with) correction for dust extinction. The flux density Fλ is in units of 10−17 erg s−1 cm−2 Å−1. The spectrum is rebinned to 2 Å per pixel.
Current usage metrics show cumulative count of Article Views (full-text article views including HTML views, PDF and ePub downloads, according to the available data) and Abstracts Views on Vision4Press platform.
Data correspond to usage on the plateform after 2015. The current usage metrics is available 48-96 hours after online publication and is updated daily on week days.
Initial download of the metrics may take a while.