Fig. 3.
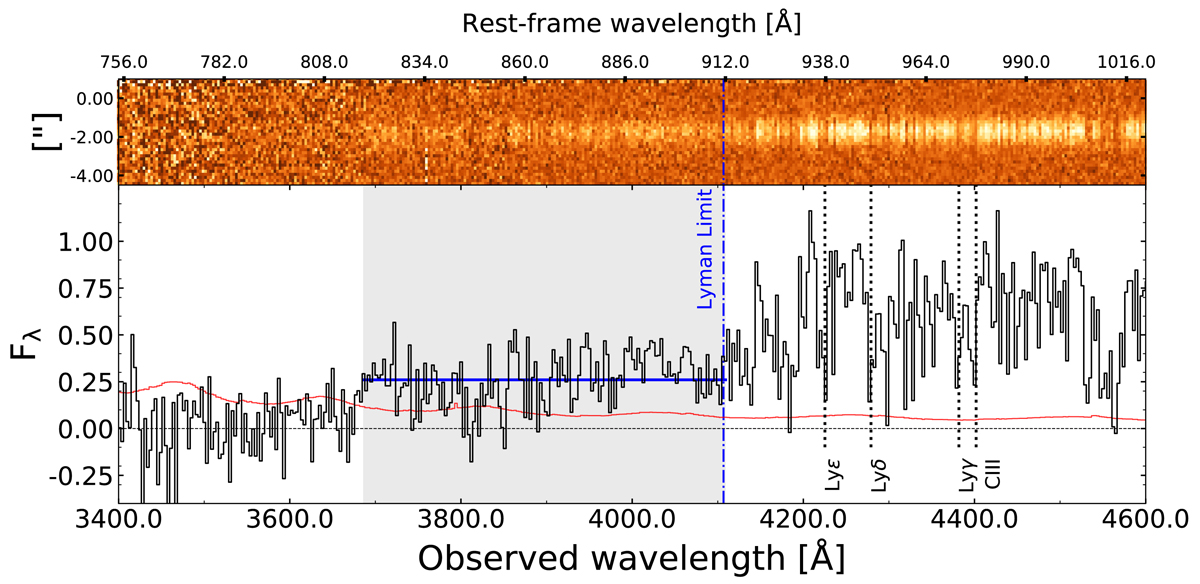
Part of the afterglow UVB spectrum of the GRB 191004B covering the 912 Å region (rest-frame). Top: 2D spectrum showing the detection of residual emission below the Lyman limit. Bottom: 1D spectrum (black line) with flux density Fλ in units of 10−17 erg s−1 cm−2 Å−1. Its associated error spectrum (1σ) is in red. The grey shaded region marks the rest-frame range 816−910 Å where residual flux below 912 Å is detected. The solid blue line represents the corresponding average LyC flux density of f900 = (2.6 ± 0.2) × 10−18 erg s−1 cm−2 Å−1 over this range. The spectrum is rebinned at 3 Å per pixel.
Current usage metrics show cumulative count of Article Views (full-text article views including HTML views, PDF and ePub downloads, according to the available data) and Abstracts Views on Vision4Press platform.
Data correspond to usage on the plateform after 2015. The current usage metrics is available 48-96 hours after online publication and is updated daily on week days.
Initial download of the metrics may take a while.