Fig. 9.
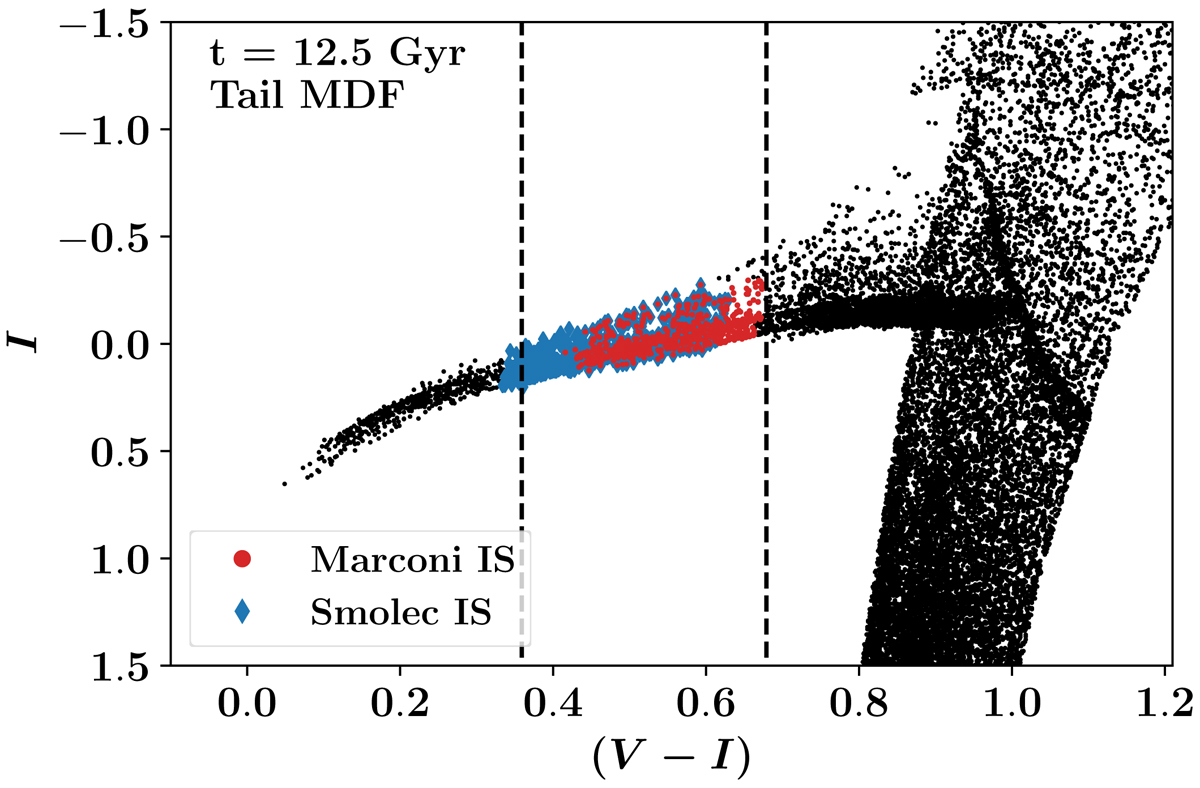
Representative I vs (V − I) colour magnitude diagram for our synthetic population models. This population has been generated using the Tail metallicity distribution function model and a mean age of 12.5 Gyr. Red circles and blue diamonds represent stars flagged as RR Lyrae using the Marconi et al. (2015) and Smolec & Moskalik (2008) instability strip models, respectively. The dashed black lines mark the intrinsic colour range of our bulge RR Lyrae sample.
Current usage metrics show cumulative count of Article Views (full-text article views including HTML views, PDF and ePub downloads, according to the available data) and Abstracts Views on Vision4Press platform.
Data correspond to usage on the plateform after 2015. The current usage metrics is available 48-96 hours after online publication and is updated daily on week days.
Initial download of the metrics may take a while.