Fig. 6.
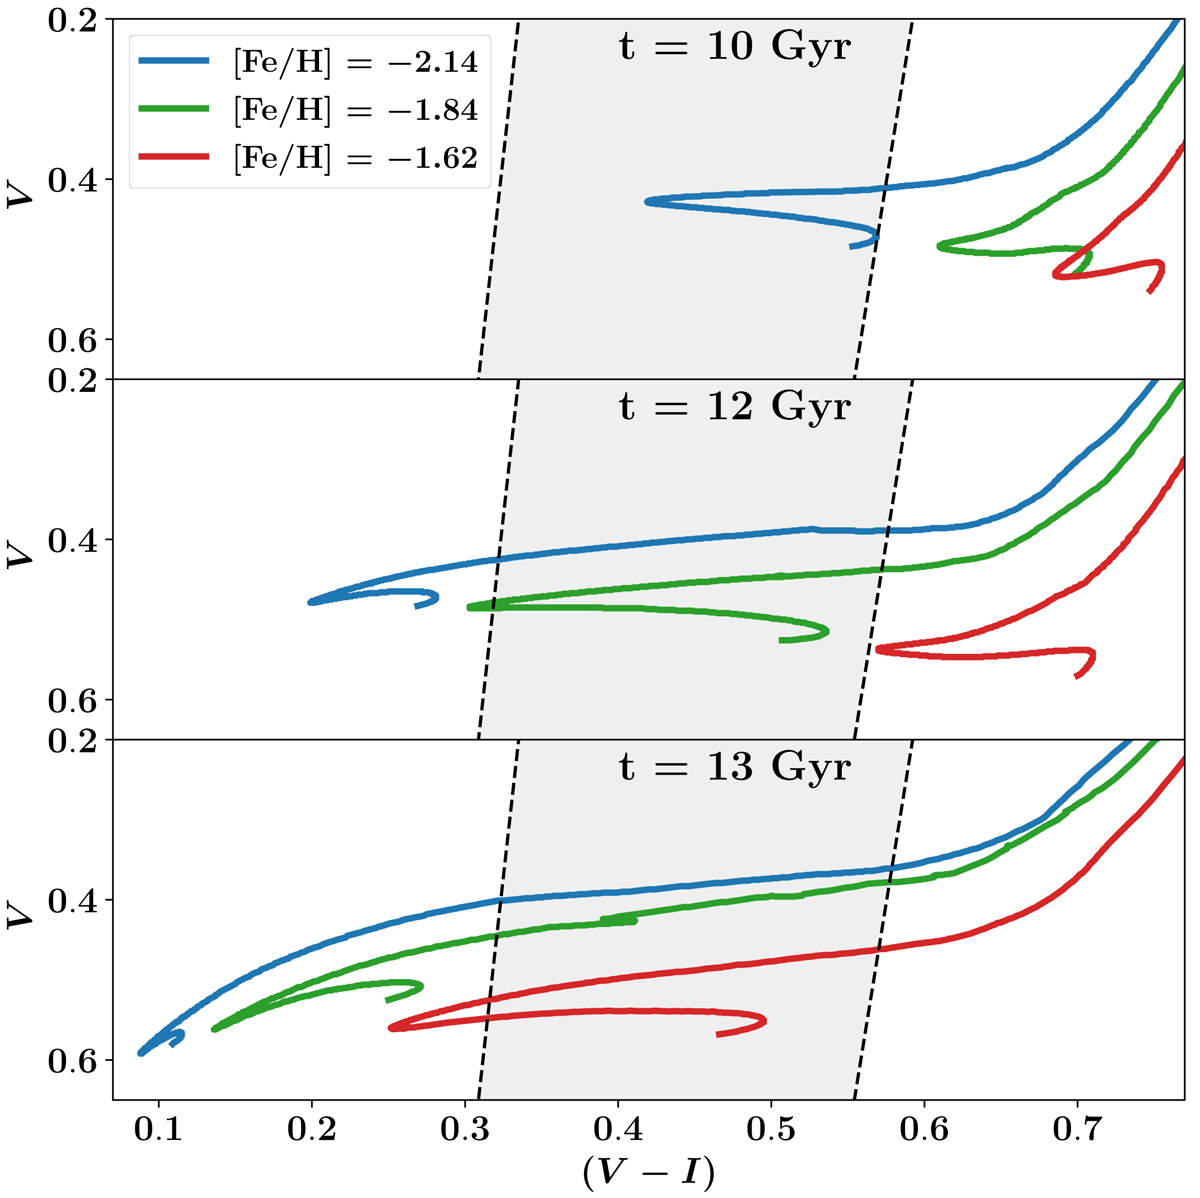
Schematic evolution of horizontal branch tracks in the V vs (V − I) colour-magnitude diagram, as function of stellar population age. Different colours represent different metallicities. The shaded grey area marks the approximate position of the pulsation instability strip. The horizontal branch tracks are assigned to a specific age following the procedure laid out in Sect. 3.
Current usage metrics show cumulative count of Article Views (full-text article views including HTML views, PDF and ePub downloads, according to the available data) and Abstracts Views on Vision4Press platform.
Data correspond to usage on the plateform after 2015. The current usage metrics is available 48-96 hours after online publication and is updated daily on week days.
Initial download of the metrics may take a while.