Fig. 1.
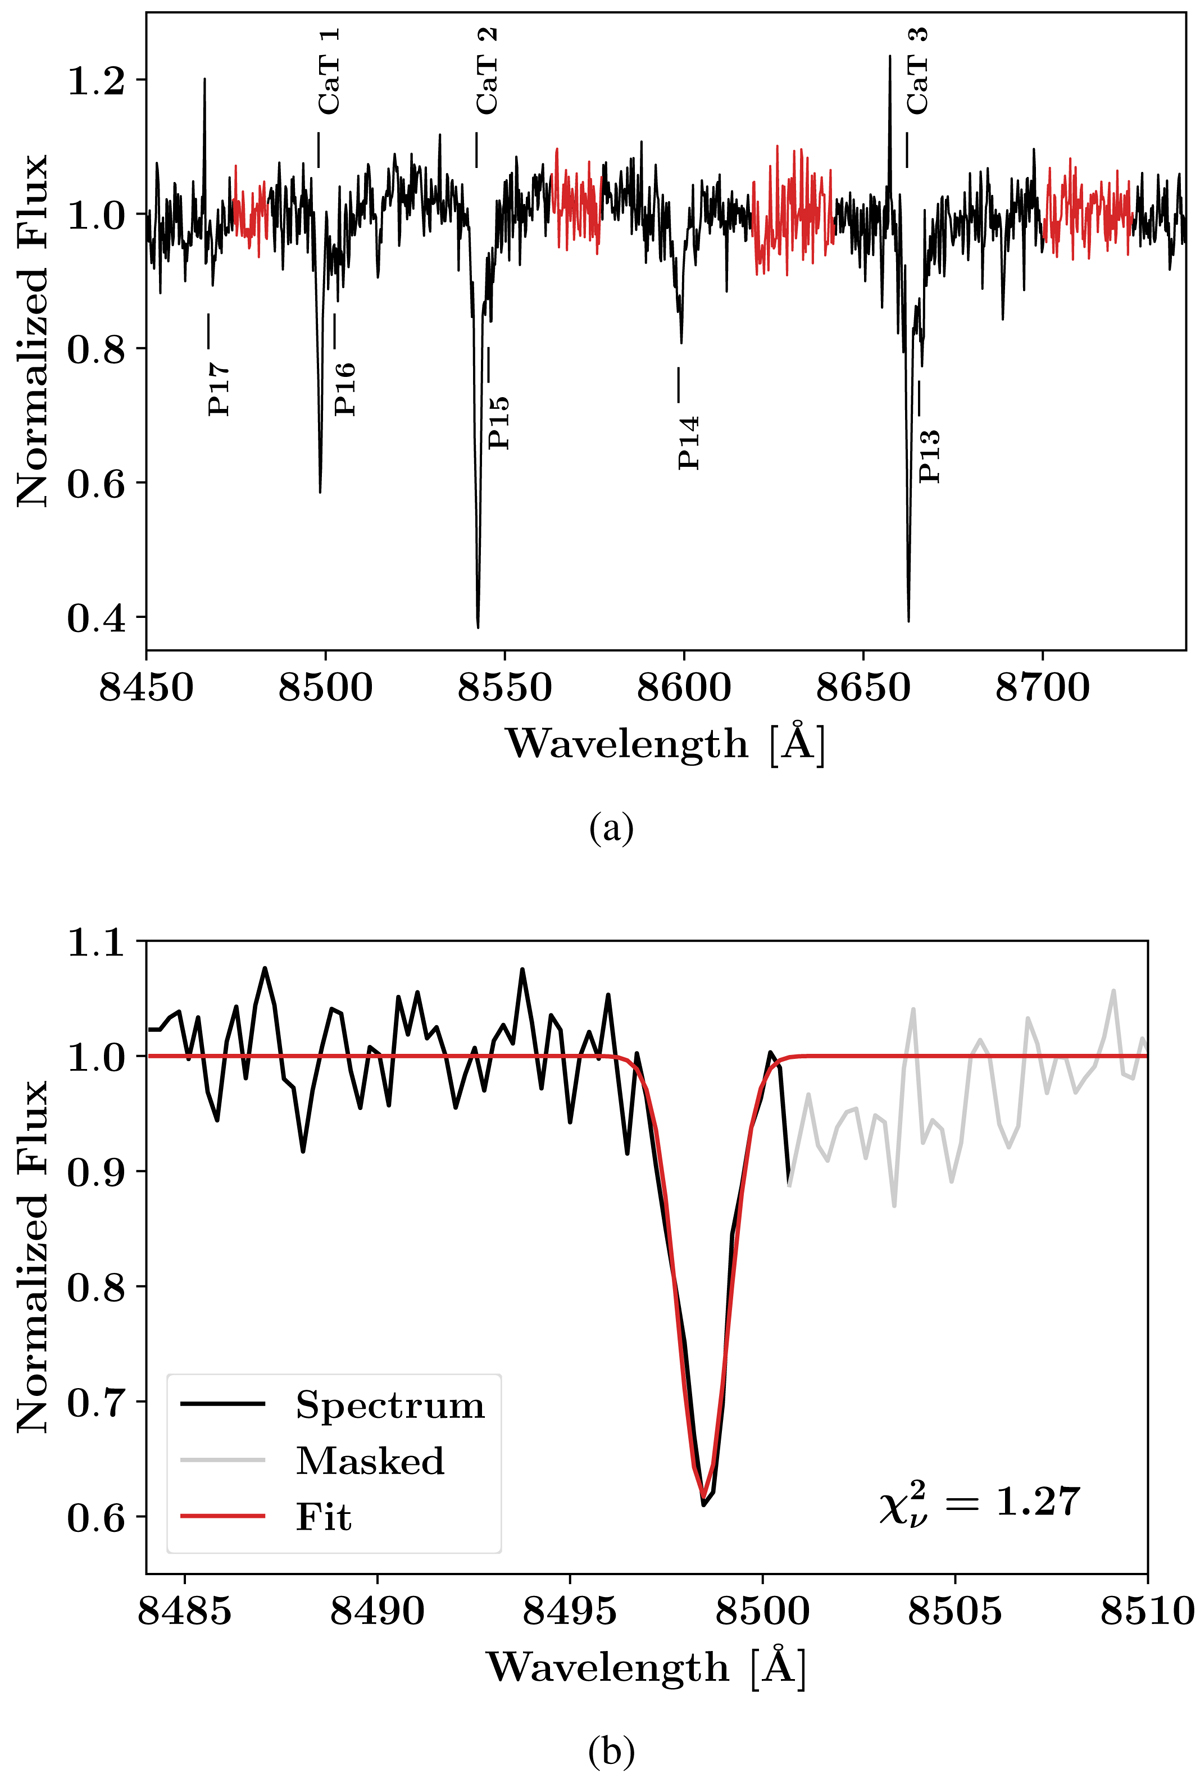
(a) Representative, continuum normalised, spectrum from our dataset. The red regions are those used for the continuum fitting. The absorption features of the calcium triplet and the hydrogen Paschen series are indicated. (b) Zoom on the calcium triplet 8498 Å line for the same spectrum. The red line shows the best-fit profile. The grey region, containing the Paschen P16 line, was excluded from the fit.
Current usage metrics show cumulative count of Article Views (full-text article views including HTML views, PDF and ePub downloads, according to the available data) and Abstracts Views on Vision4Press platform.
Data correspond to usage on the plateform after 2015. The current usage metrics is available 48-96 hours after online publication and is updated daily on week days.
Initial download of the metrics may take a while.