Fig. 9
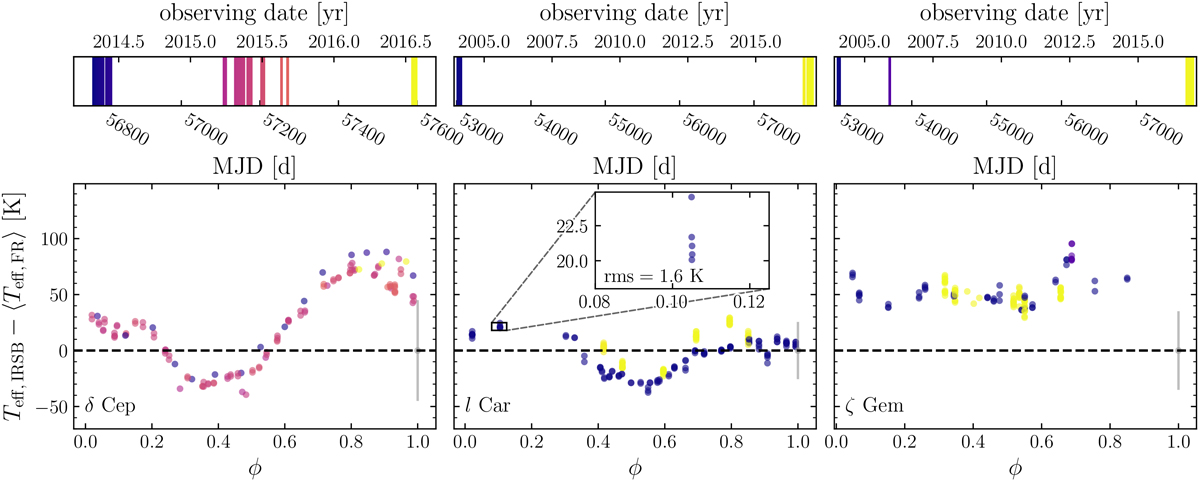
Representative examples of the three distinct residual patterns as discussed in the text: δ Cep (IRSB issuesseemingly constant with MJD, left panel); l Car (IRSB issueswith MJD-dependence, middle panel); ζ Gem (constant offset possibly due to erroneous reddening, right panel). Shown are the median residuals of the best 100 trained relations that were measured in individual spectra with respect to the input labels. The abscissa indicates the pulsation phase, ϕ. As in Fig. 1, the color coding resembles the time of observation of the individual spectra (cf., upper panels). Typical values for the 1 σ scatter are depicted by gray error bars. The inlay in the middle panel highlights five spectra of l Car that were taken with HARPS back to back within less than 30 min. The rms scatter of 1.6 K underlines the internal precision of our method.
Current usage metrics show cumulative count of Article Views (full-text article views including HTML views, PDF and ePub downloads, according to the available data) and Abstracts Views on Vision4Press platform.
Data correspond to usage on the plateform after 2015. The current usage metrics is available 48-96 hours after online publication and is updated daily on week days.
Initial download of the metrics may take a while.