Fig. 8
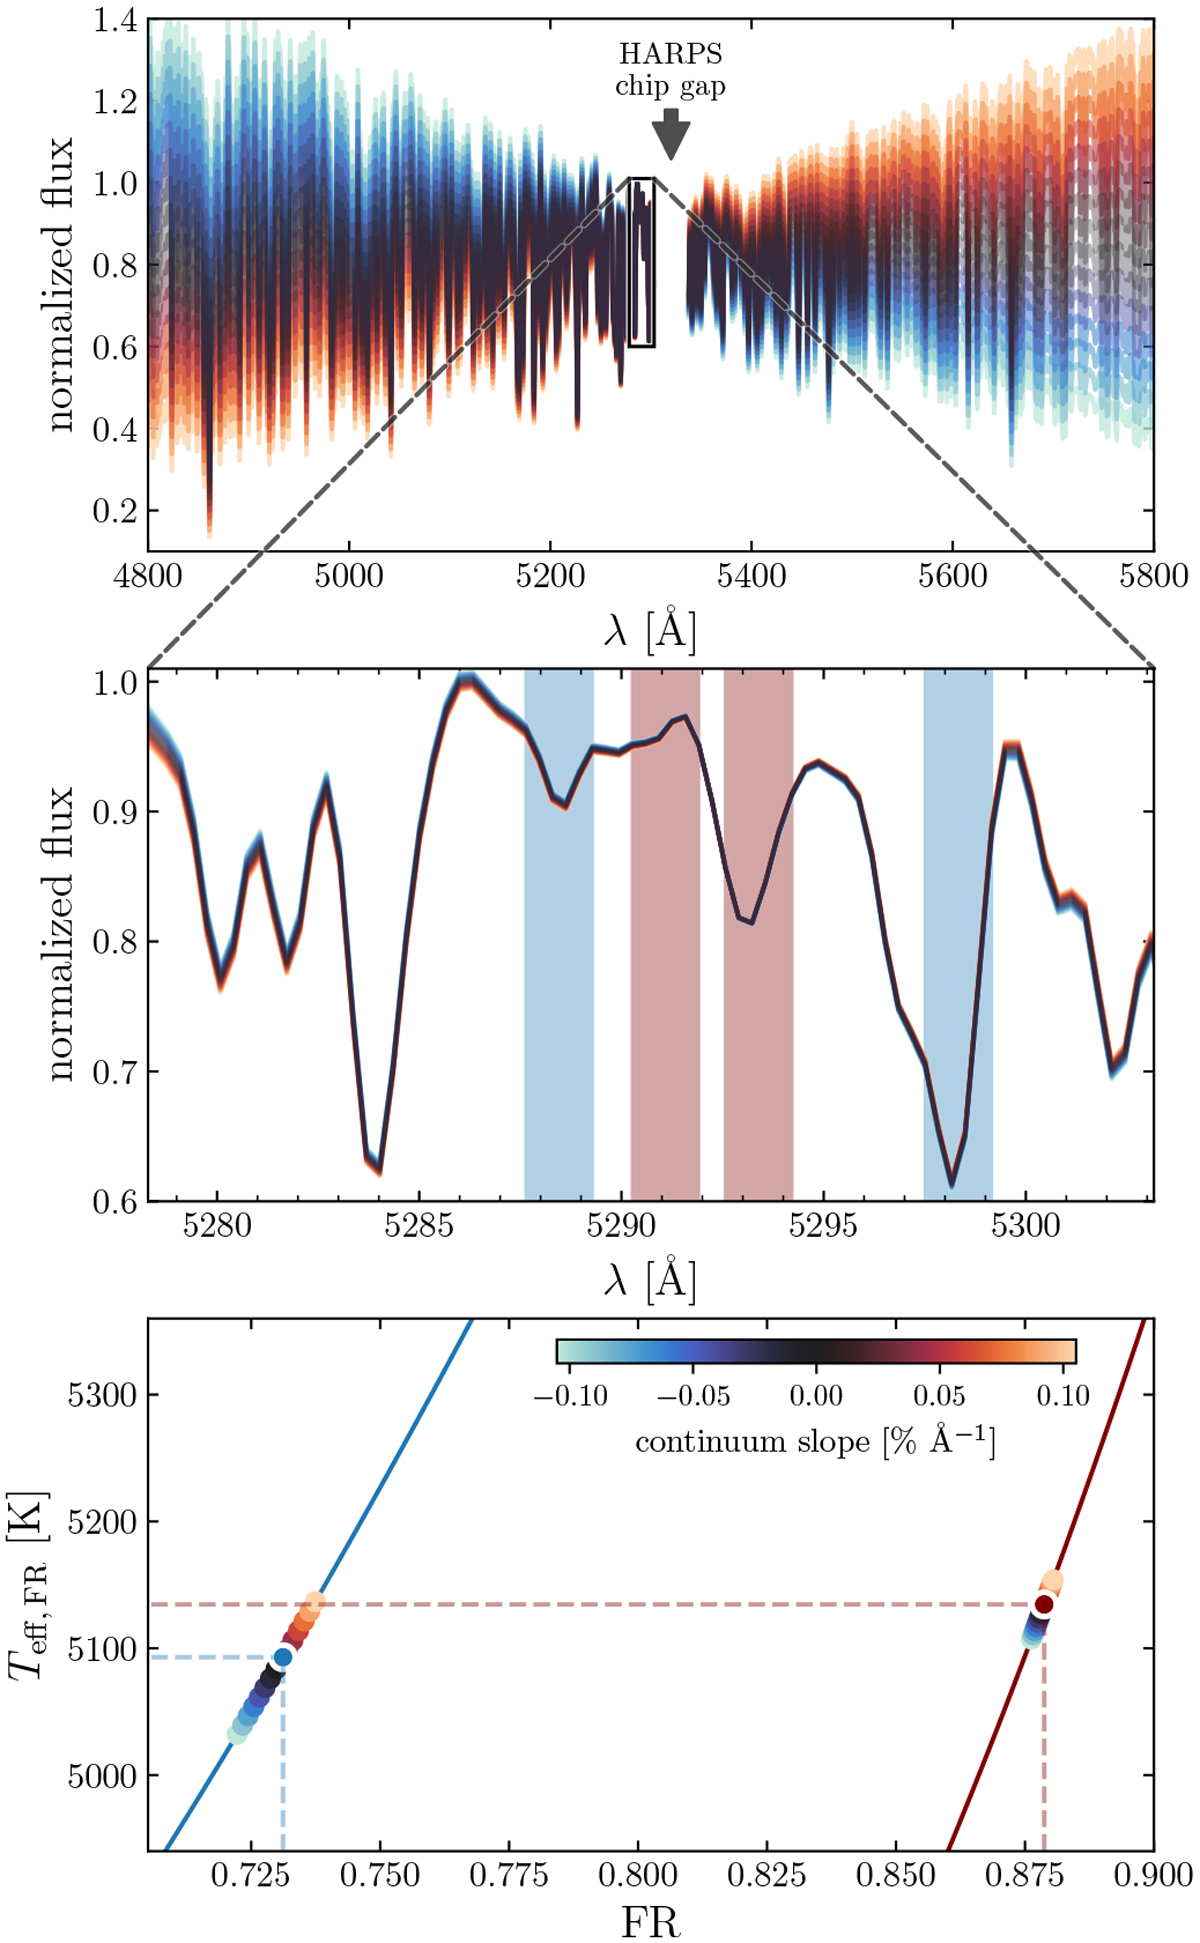
Impact of continuum variations on FRs from close- (red) and wide-spaced (blue) wavelength components. Upper panel: 15 times the same ζ Gem spectrum as was used in Sect. 4.1 with varying continuum slopes (see color bar in lower panel). The missing part in the presented spectrum corresponds to HARPS’ chip gap. Middle panel: zoomed-in view of the region around ~ 5295 Å where the λ regions are highlighted by vertical spans. Lower panel: deduced Teff, FR values as a function of the measured FRs at different continuum slopes. The models are represented by red and blue solid curves while dashed red and blue lines and filled circles of the same colors indicate the finding from the original spectrum without any modification of the continuum.
Current usage metrics show cumulative count of Article Views (full-text article views including HTML views, PDF and ePub downloads, according to the available data) and Abstracts Views on Vision4Press platform.
Data correspond to usage on the plateform after 2015. The current usage metrics is available 48-96 hours after online publication and is updated daily on week days.
Initial download of the metrics may take a while.