Fig. 7
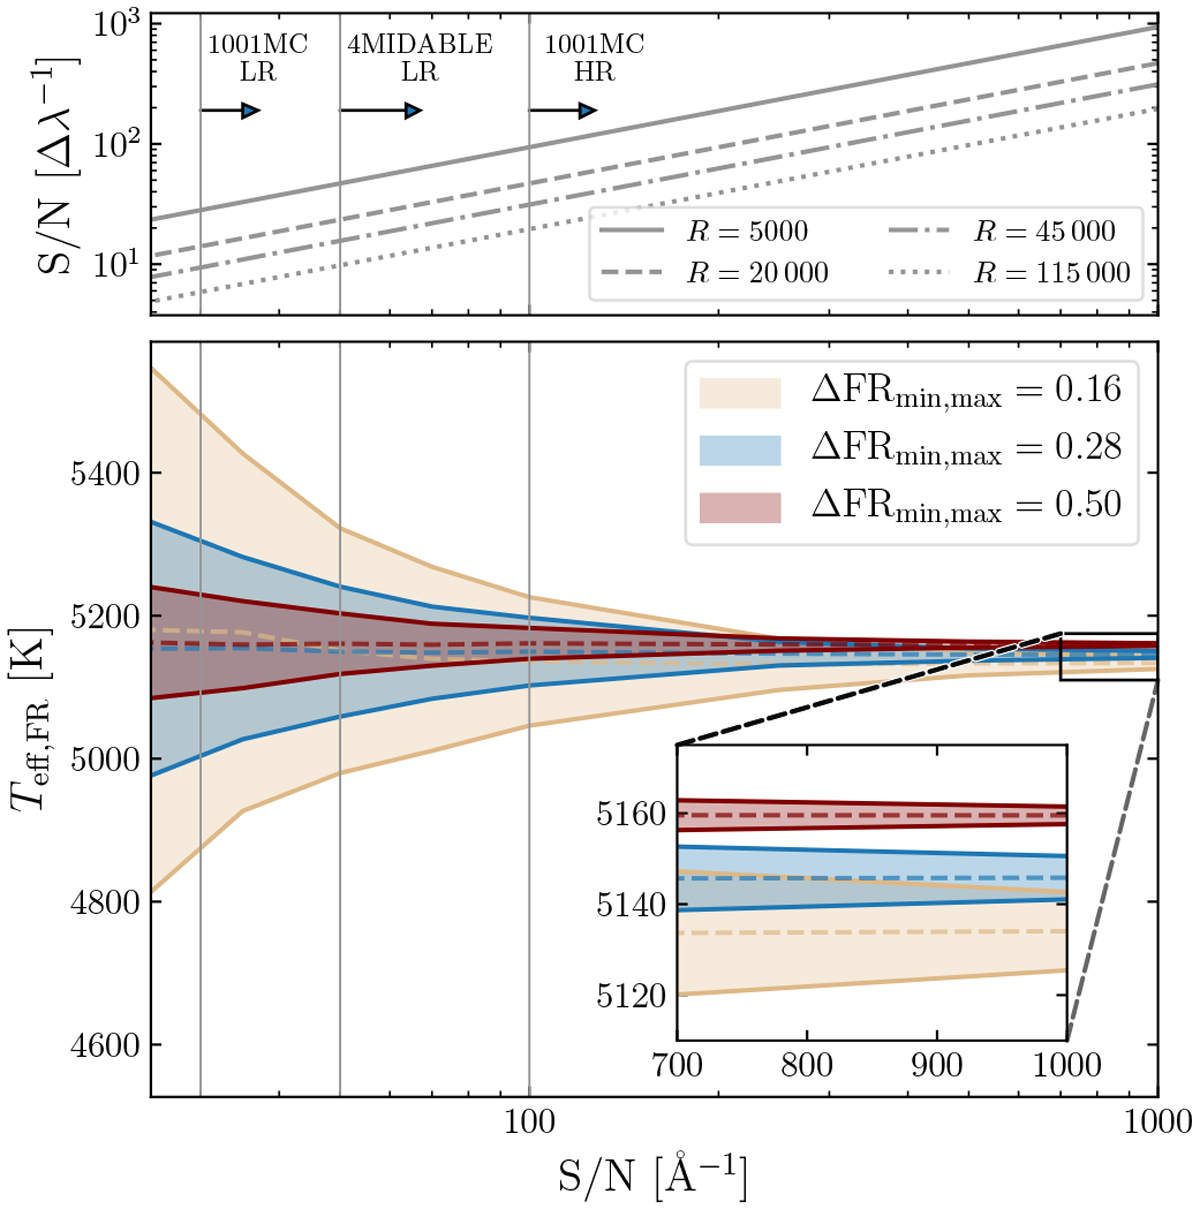
Stability against S/N per Å for three relations of different maximum FR excursion (cf., color coding and legend in the lower panel). The corresponding S/N per resolution element for four different resolving powers (see legend) are given in the top panel. Shown are the measured mean values (colored dashed lines) and 1 σ standard deviations (solid lines enclosing filled areas) from an MC simulation with artificially injected noise (see main text for details). The zoom-in view emphasizes the (marginal) relation-to-relation inaccuracies (see middle panel of Fig. 10). Vertical lines indicate the minimum S/N requirements for different 4MOST consortium surveys: S∕N = 50 Å−1 in the magnesium or calcium triplet regions (4MIDABLE-LR10); S∕N = 30 Å−1 in the magnesium or calcium triplet regions (1001MC11, LR); S∕N = 100 Å−1 at 6200 Å (1001MC, HR; 4MIDABLE-HR12).
Current usage metrics show cumulative count of Article Views (full-text article views including HTML views, PDF and ePub downloads, according to the available data) and Abstracts Views on Vision4Press platform.
Data correspond to usage on the plateform after 2015. The current usage metrics is available 48-96 hours after online publication and is updated daily on week days.
Initial download of the metrics may take a while.