Fig. 4
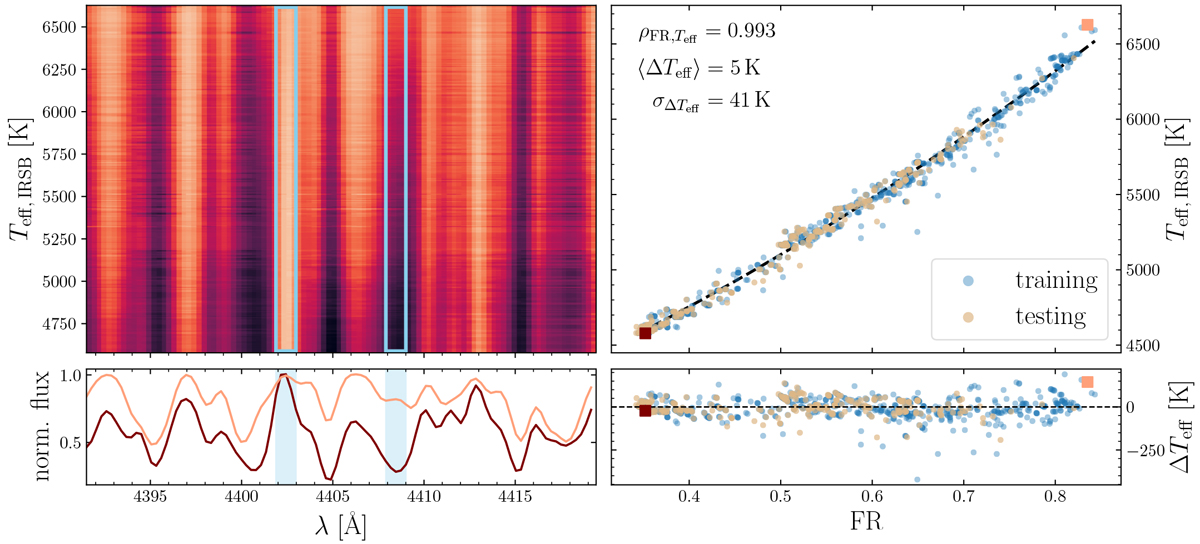
Properties of an individual relation using flux ratios around 4405 Å. Top left panel: evolution of the neighboring spectral domain with Teff, where darker colors indicate deeper features. Bottom left panel: coolest (dark brown) and hottest (orange) spectra at our disposal. For illustration purposes, the spectra were pseudo-normalized by the 99th percentile of the flux in the presented range. In both panels, the regions considered for computing the flux ratios are marked in clear blue. Top right panel: analytical relation (dashed black curve) together with the Teff labels for the training (blue) and testing (pale brown) samples. Using the same color coding, bottom right panel: difference between the temperatures computed using the individual analytical relation and the input labels. In both panels, the coolest and hottest spectra are again depicted in dark brown and orange, respectively.
Current usage metrics show cumulative count of Article Views (full-text article views including HTML views, PDF and ePub downloads, according to the available data) and Abstracts Views on Vision4Press platform.
Data correspond to usage on the plateform after 2015. The current usage metrics is available 48-96 hours after online publication and is updated daily on week days.
Initial download of the metrics may take a while.