Fig. 11
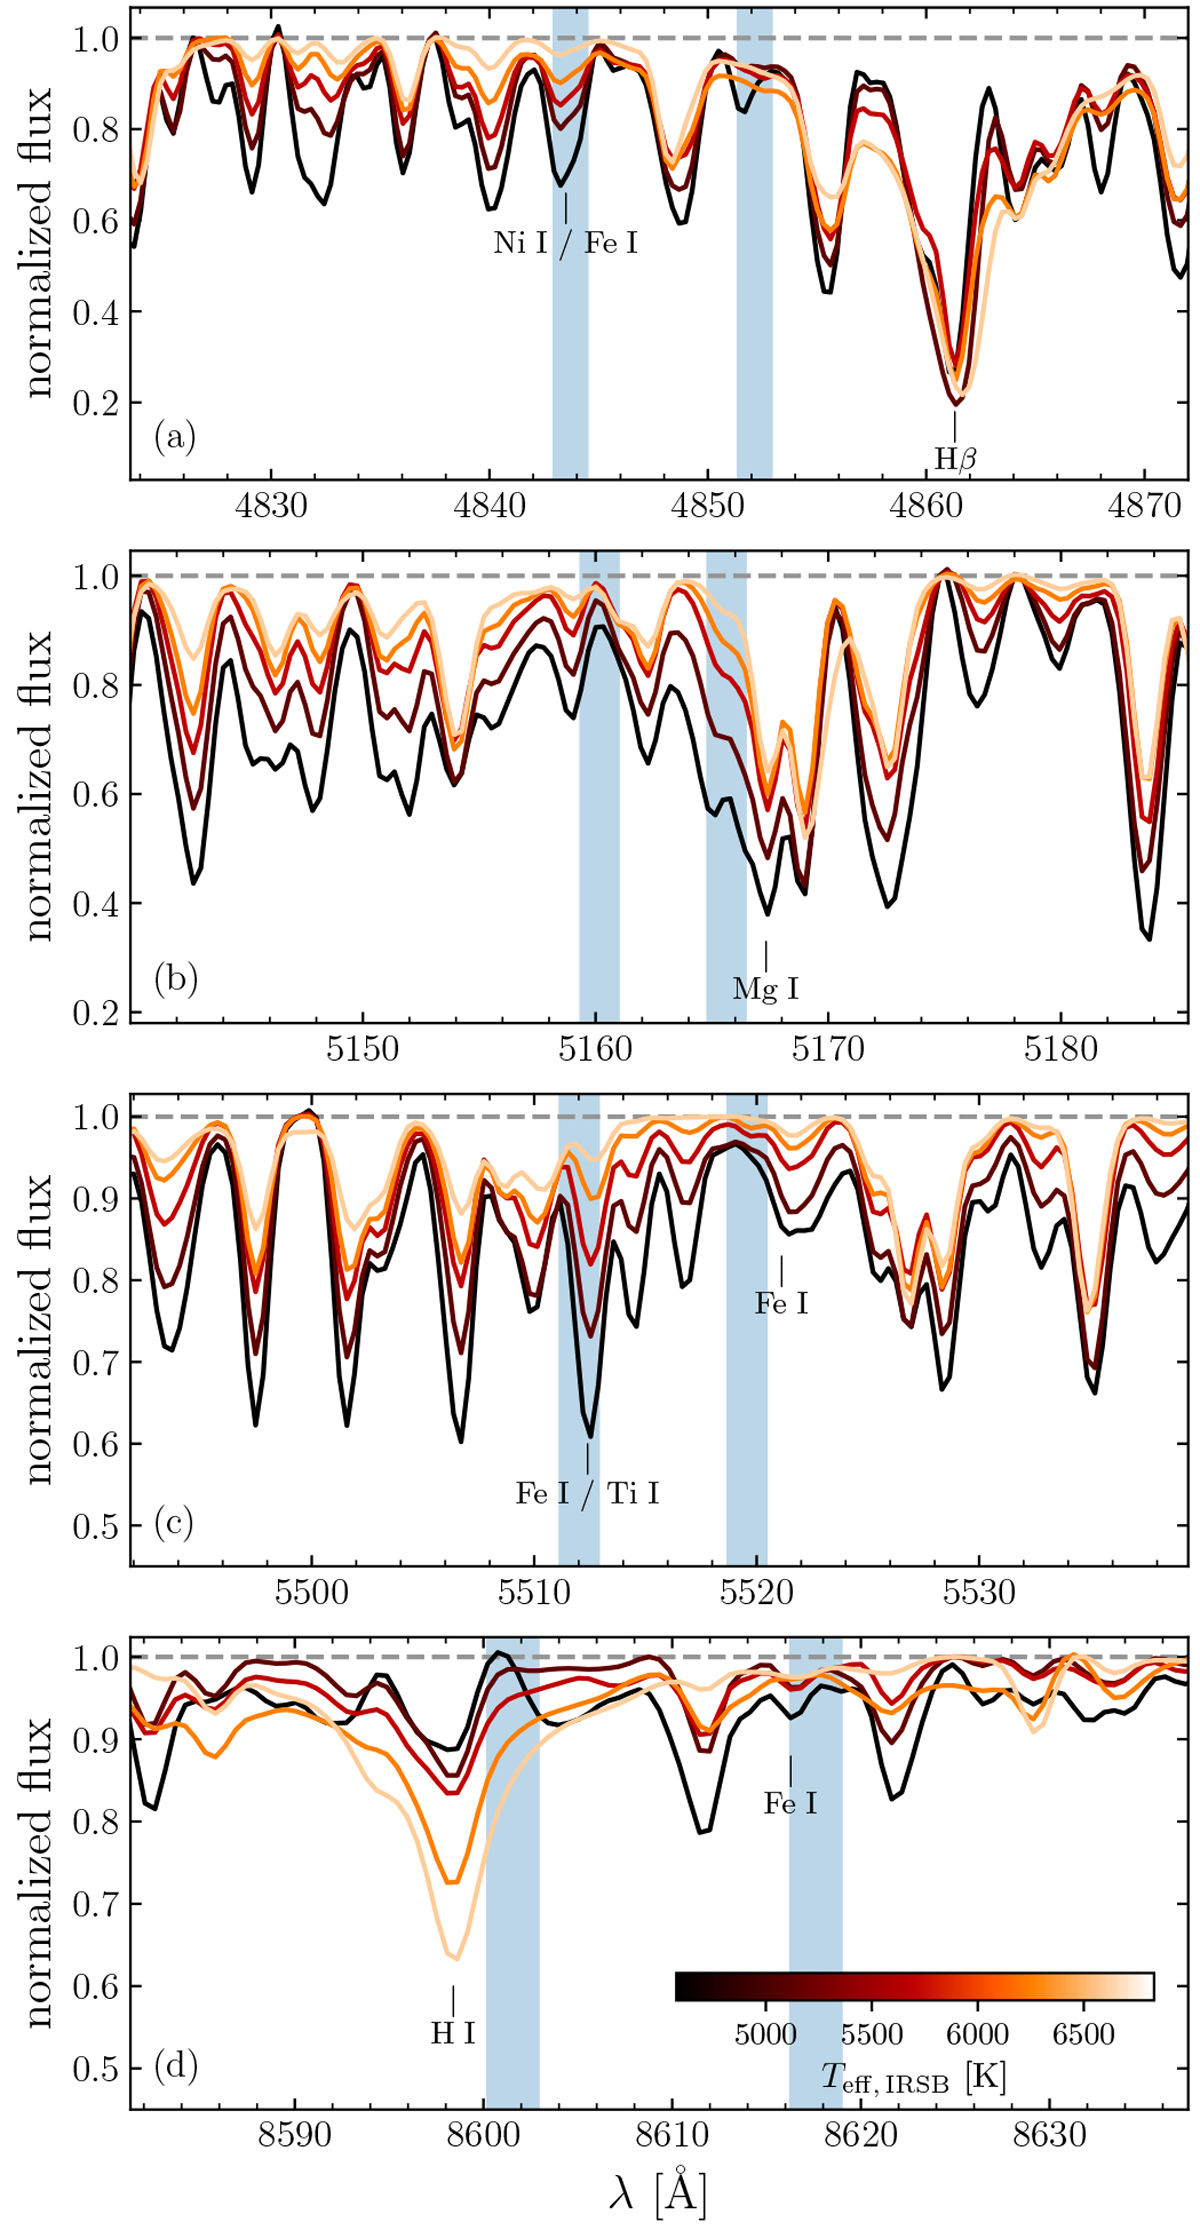
Illustration of a few spectral domains where Teff-sensitive flux ratios have been recovered: a) blue wing of Hβ, b) MgT region, c) metallic lines around 5510 Å, d) H I line in the near-infrared. See Sect. 4.4 for details. Spectra are color-coded by temperature, where darker colors indicate cooler temperatures. For illustration purposes, the spectra were pseudo-normalized by the 99th percentile of the flux in the presented range.
Current usage metrics show cumulative count of Article Views (full-text article views including HTML views, PDF and ePub downloads, according to the available data) and Abstracts Views on Vision4Press platform.
Data correspond to usage on the plateform after 2015. The current usage metrics is available 48-96 hours after online publication and is updated daily on week days.
Initial download of the metrics may take a while.