Fig. 10
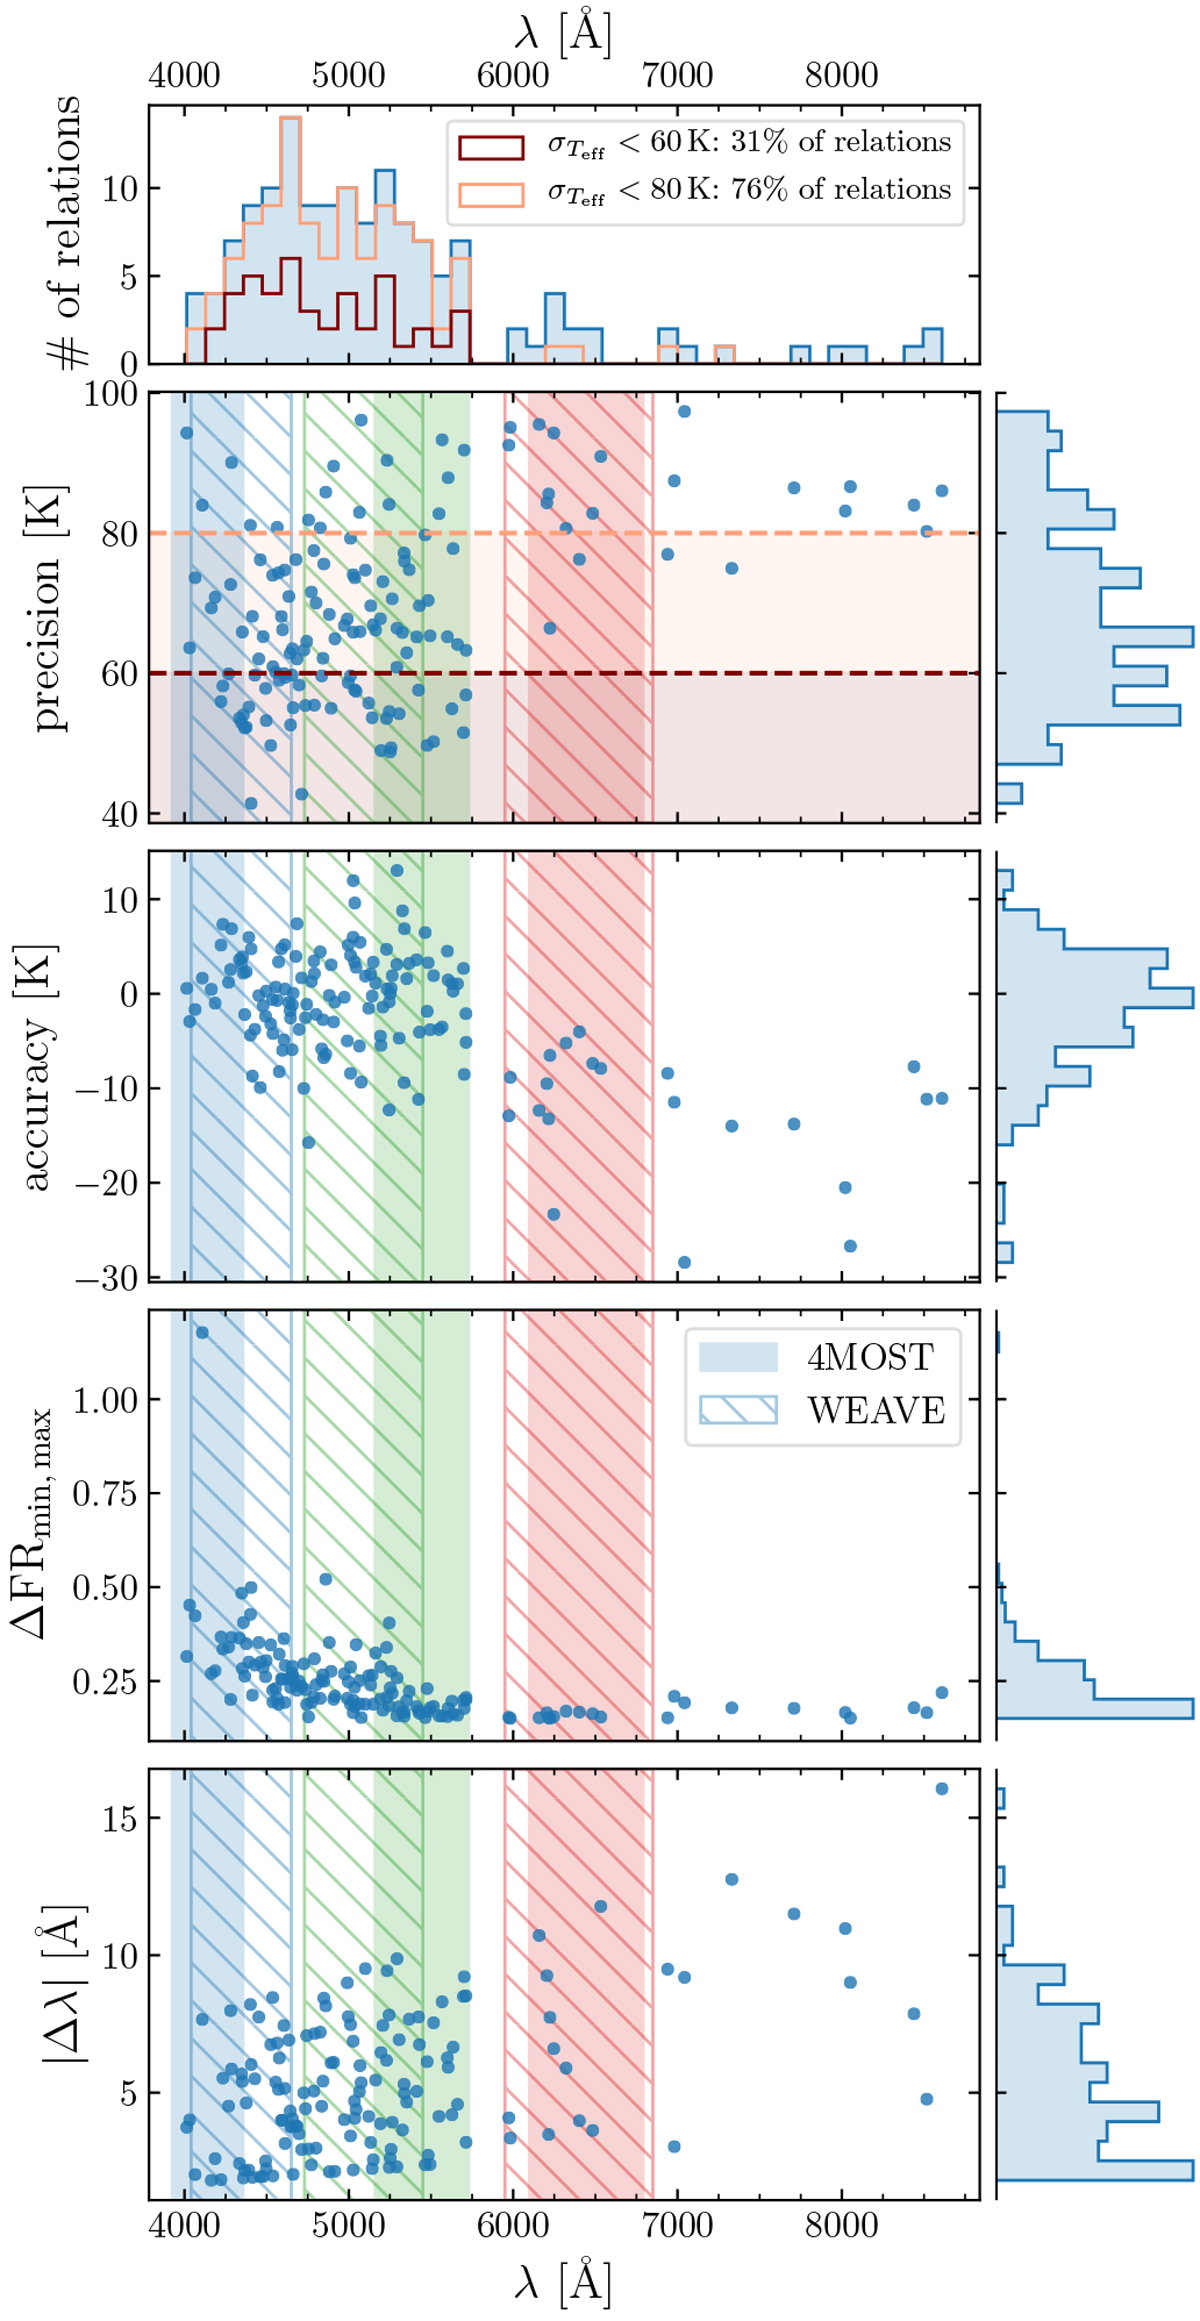
Distribution of the properties of FRs as a function of wavelength. Blue, green, and red vertical spans depict the three spectral windows of 4MOST (filled) and WEAVE (hatched) high-resolution spectrographs. Upper panel: number of independent relations to derive Teff from flux ratios per wavelength range. Second panel: precision of individual relations to derive Teff from flux ratios as a function of wavelength. Third panel: accuracy of individual relations to derive Teff from flux ratios as a function of wavelength. Fourth panel: flux ratio excursion, ΔFRmin, max, as a functionof wavelength. Bottom panel: wavelength spacing Δλ of the two components of a ratio as a function of wavelength.
Current usage metrics show cumulative count of Article Views (full-text article views including HTML views, PDF and ePub downloads, according to the available data) and Abstracts Views on Vision4Press platform.
Data correspond to usage on the plateform after 2015. The current usage metrics is available 48-96 hours after online publication and is updated daily on week days.
Initial download of the metrics may take a while.