Fig. 3.
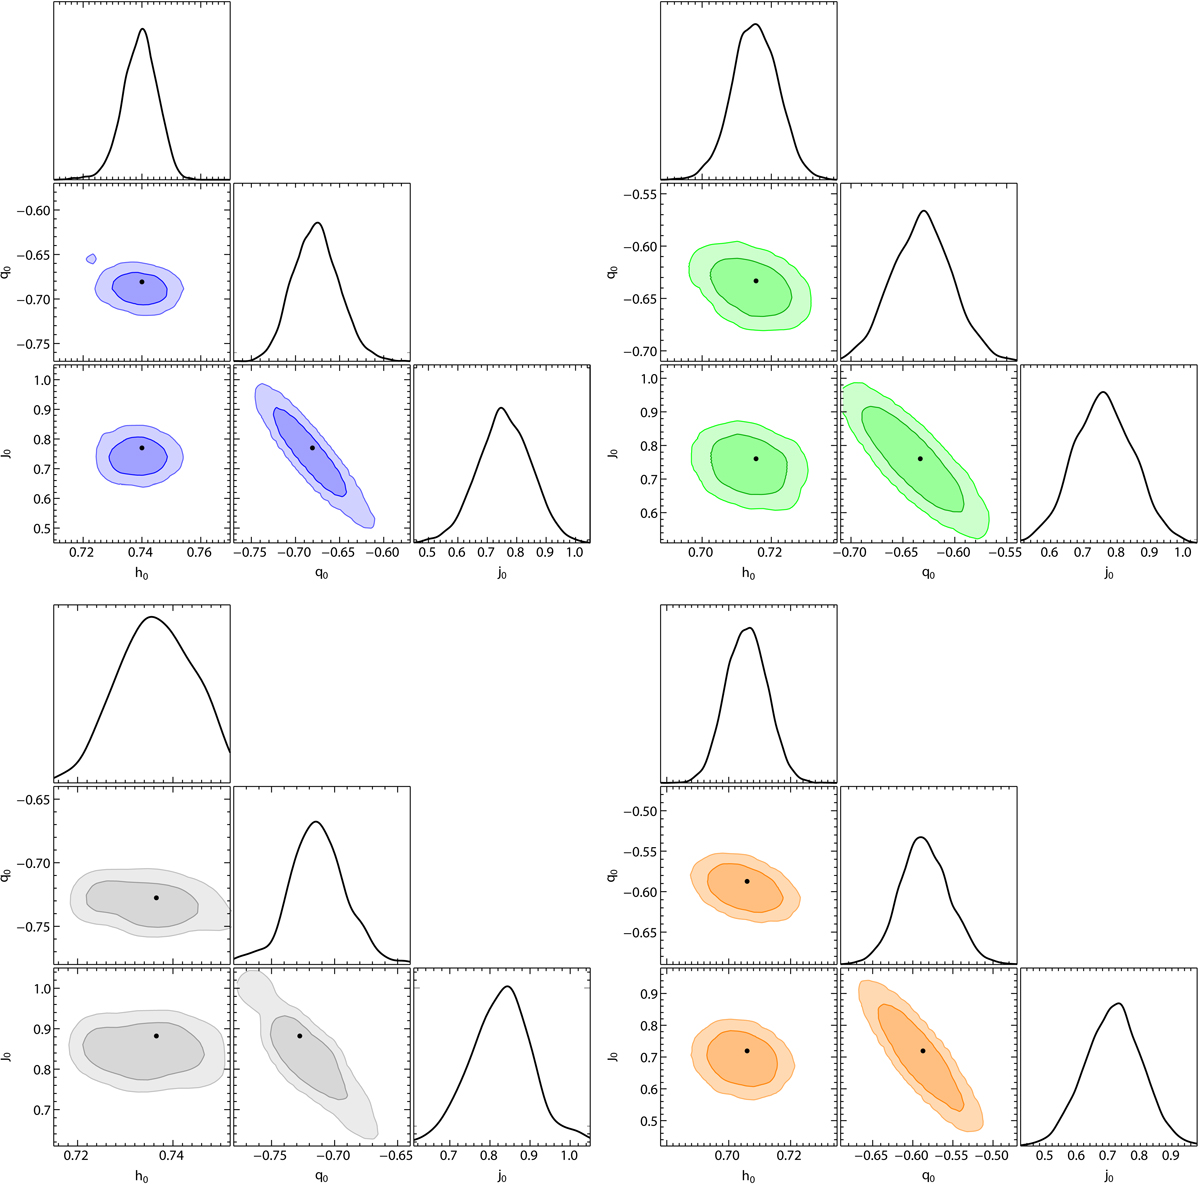
Contours of our MCMC analyses for hierarchy 1 Taylor expansions. Best fits (black points), prompted with 1 − σ (darker areas) and 2 − σ (lighter areas) confidence levels, refer to SN+BAO+GRB, in particular: Amati (top left), Ghirlanda (top right), Yonetoku (bottom left), and combo (bottom right) data sets. The results indicate a slight spread when comparing q0 and j0 values, with approximatively Gaussian distributions.
Current usage metrics show cumulative count of Article Views (full-text article views including HTML views, PDF and ePub downloads, according to the available data) and Abstracts Views on Vision4Press platform.
Data correspond to usage on the plateform after 2015. The current usage metrics is available 48-96 hours after online publication and is updated daily on week days.
Initial download of the metrics may take a while.