Free Access
Fig. 2.
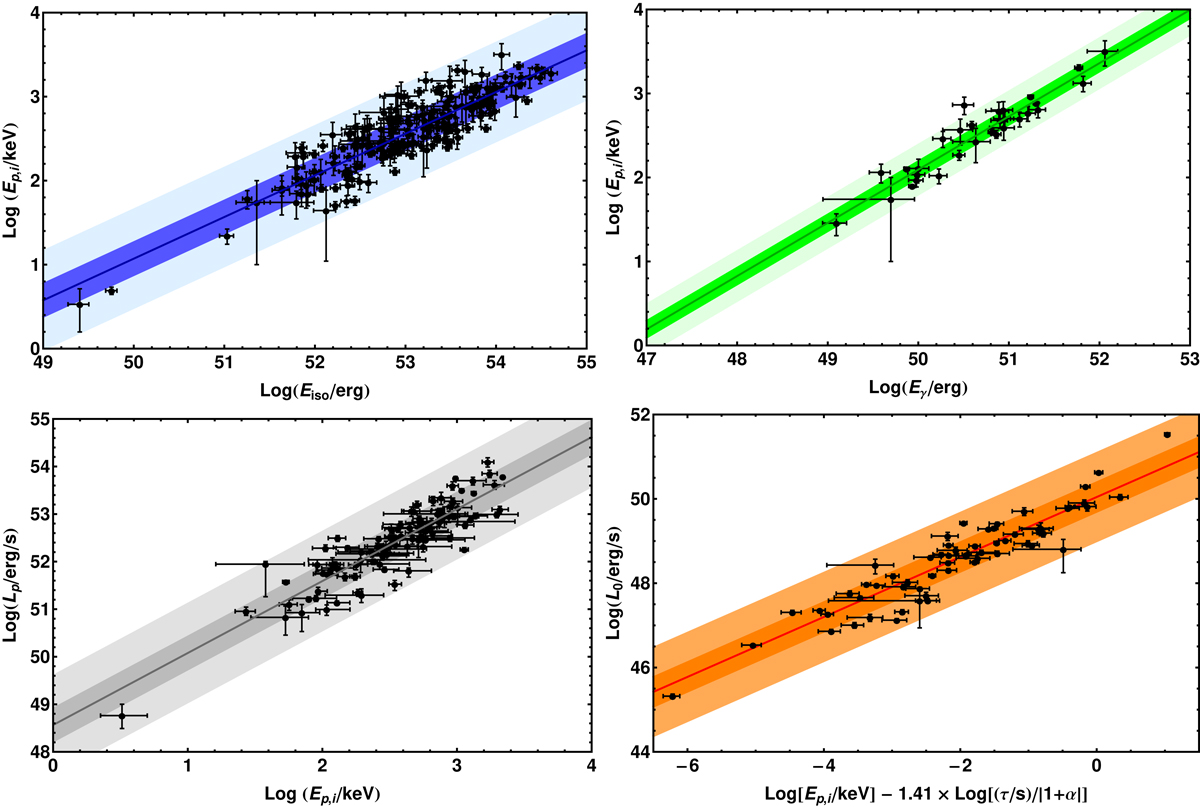
Best fits (solid lines), their 1σ (dark shaded areas) and 3σ (light shaded areas) dispersions, and associated data sets (black points) of the calibrated GRB correlations considered in this work. Top-left: Amati correlation; top-right: Ghirlanda correlation; bottom-left: Yonetoku correlation; bottom-right: combo correlation.
Current usage metrics show cumulative count of Article Views (full-text article views including HTML views, PDF and ePub downloads, according to the available data) and Abstracts Views on Vision4Press platform.
Data correspond to usage on the plateform after 2015. The current usage metrics is available 48-96 hours after online publication and is updated daily on week days.
Initial download of the metrics may take a while.