Free Access
Fig. 1.
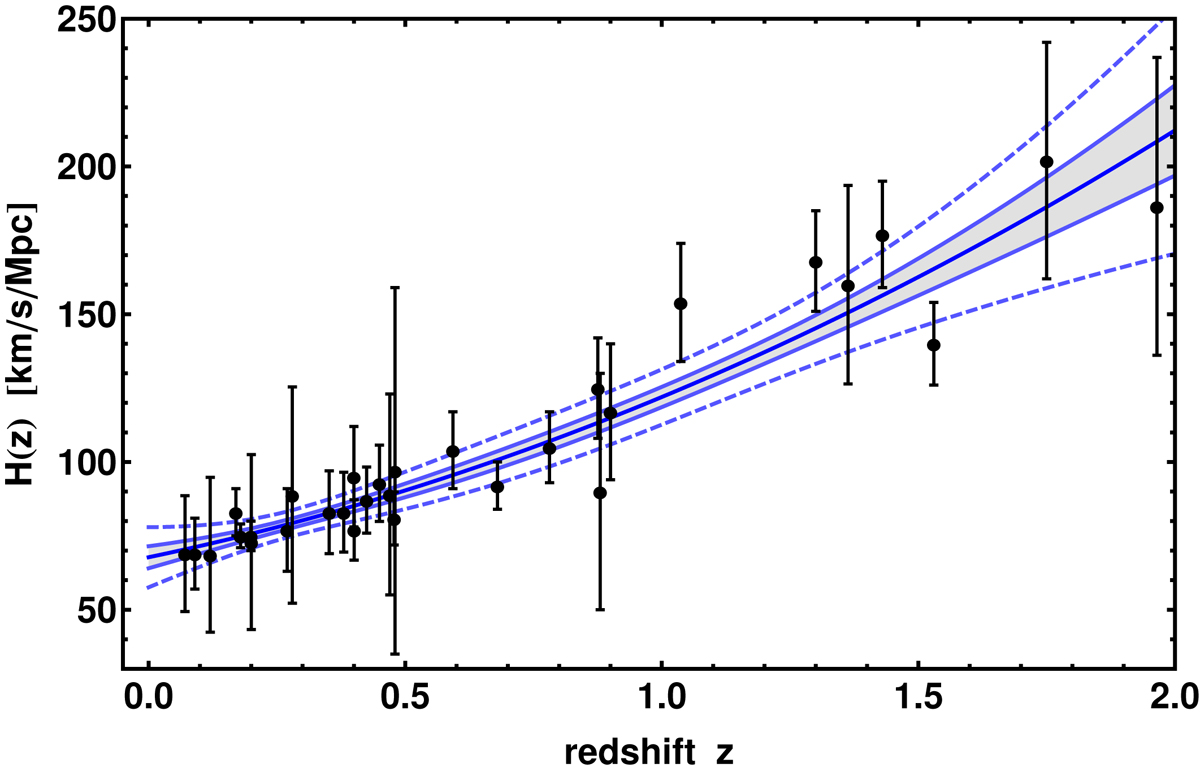
H2(z) function (solid thick blue) fitting OHD data (black points), with the 1σ (blue curves and shaded area) and 3σ (blue dashed curves) confidence regions. Reproduced from Amati et al. (2019).
Current usage metrics show cumulative count of Article Views (full-text article views including HTML views, PDF and ePub downloads, according to the available data) and Abstracts Views on Vision4Press platform.
Data correspond to usage on the plateform after 2015. The current usage metrics is available 48-96 hours after online publication and is updated daily on week days.
Initial download of the metrics may take a while.