Fig. 3.
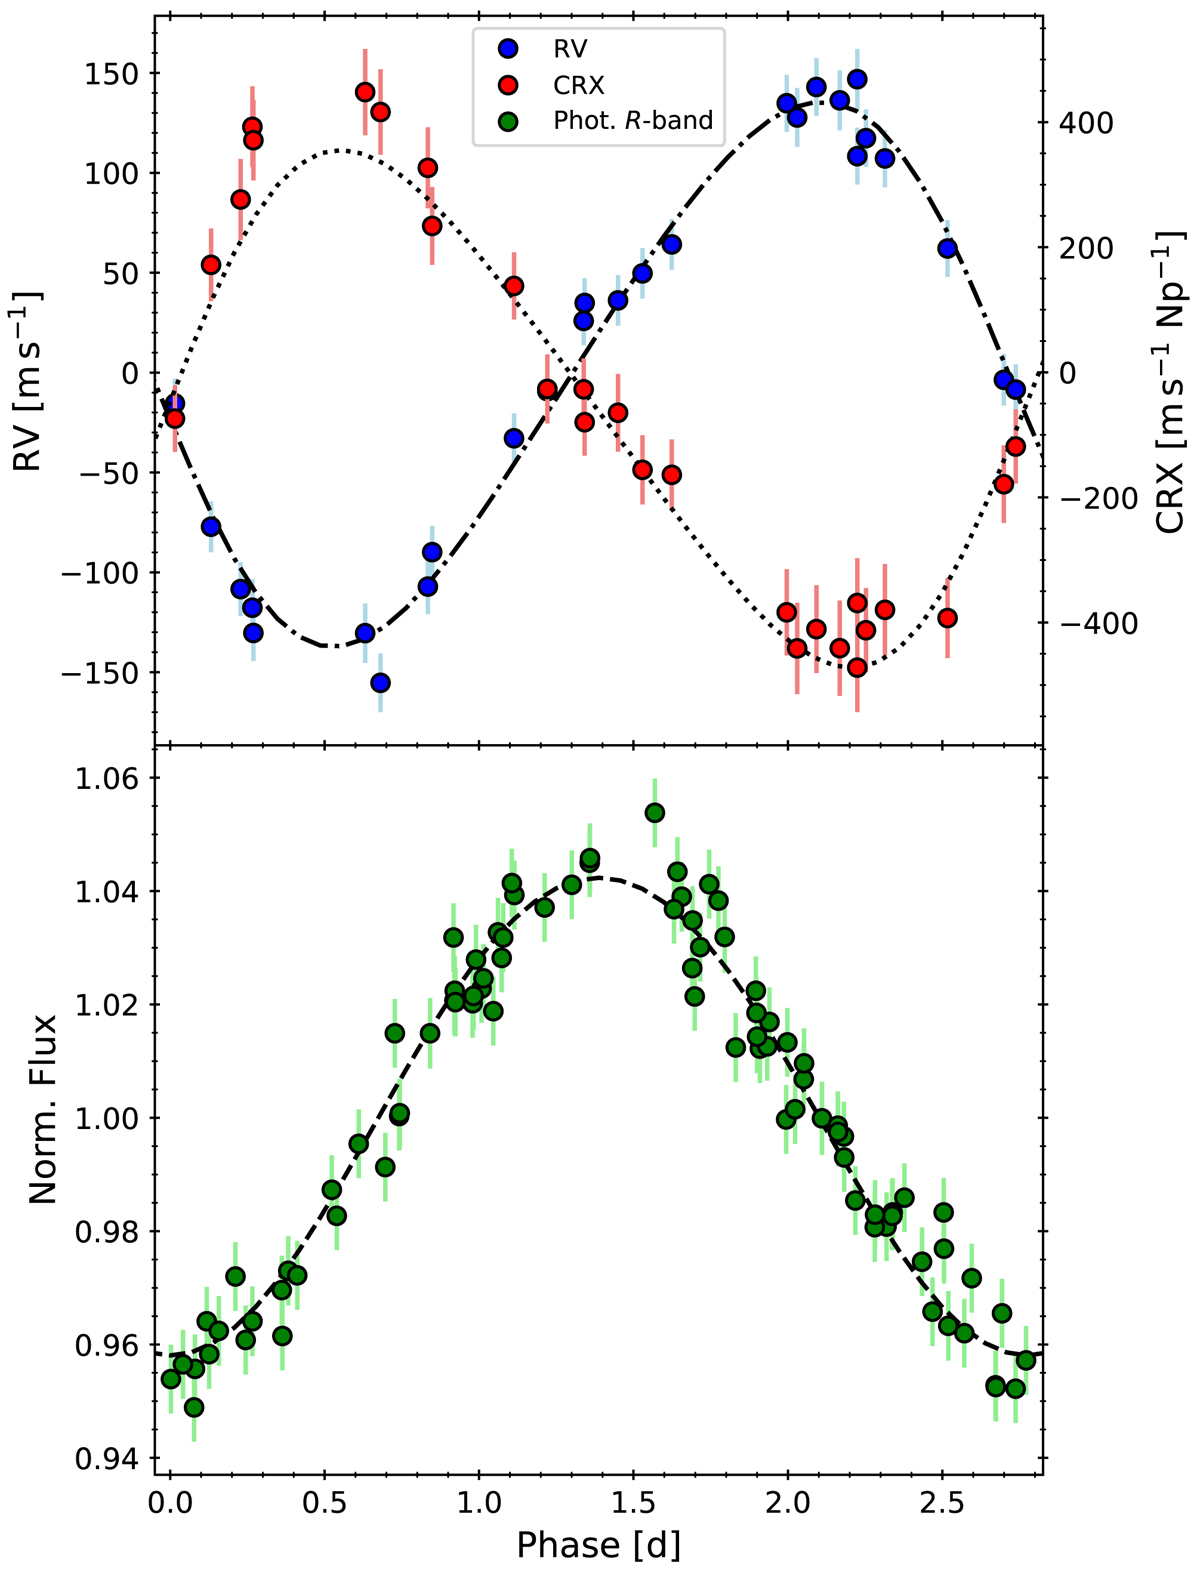
Phase-folded RV (blue circles), CRX (red circles), and photometric (green circles) data obtained for YZ CMi. Top panel: the left and right vertical axes correspond to RV and CRX, respectively. The best models that simultaneously fit the three datasets are shown as dash-dotted (RVs) and dotted (CRX) lines, and they correspond to the values found in Table 2. The error bars correspond to the quadrature addition between observational uncertainties and the fit jitter parameter for each dataset.
Current usage metrics show cumulative count of Article Views (full-text article views including HTML views, PDF and ePub downloads, according to the available data) and Abstracts Views on Vision4Press platform.
Data correspond to usage on the plateform after 2015. The current usage metrics is available 48-96 hours after online publication and is updated daily on week days.
Initial download of the metrics may take a while.