Fig. 1.
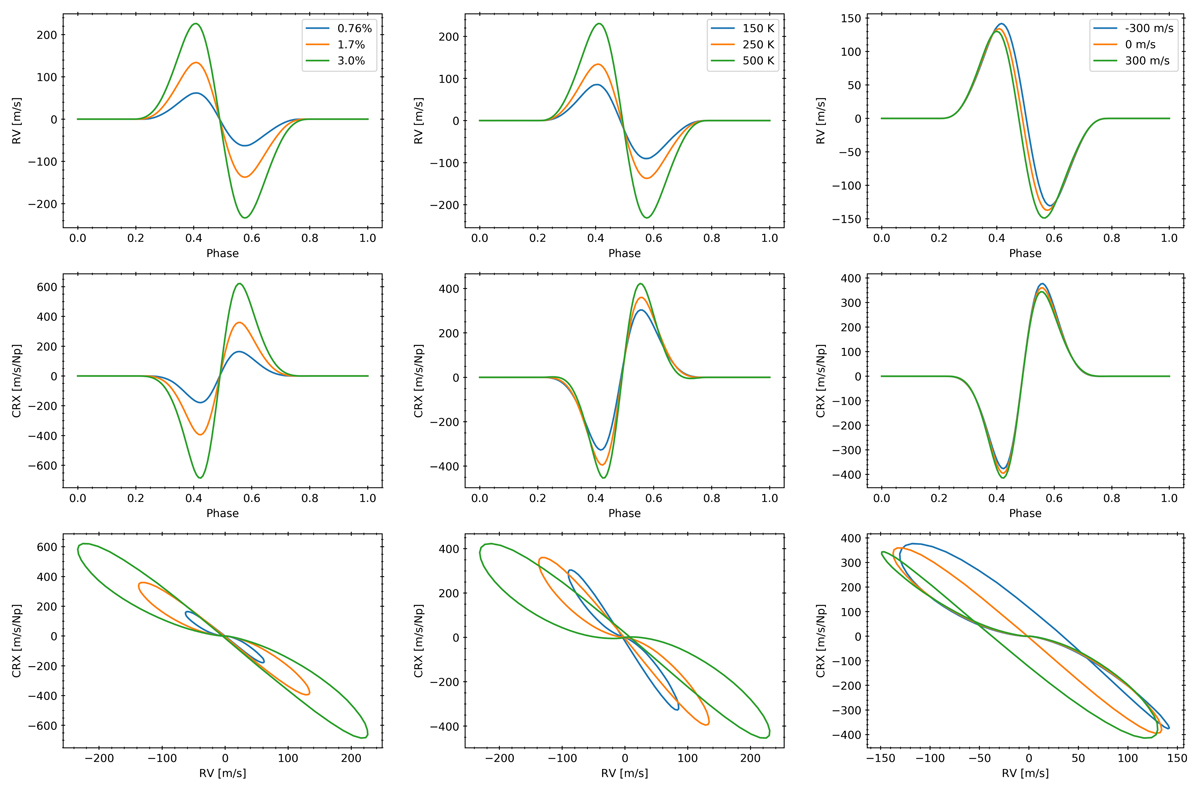
Effect of properties of stellar spots on the RV (top panels) and CRX (middle panels) phase curves and on the RV-CRX correlation (bottom panels) for a mid-M dwarf. Simulations of varying ff (left panels), ΔT (middle panels), and CS (right panels) are shown while keeping the other parameters constant to a set of reference values. These reference values are 1.7% for the filling factor, 250 K for ΔT, and 0 m s−1 for CS. We note the different vertical scale in each plot, and that the horizontal axes are different in the bottom panels.
Current usage metrics show cumulative count of Article Views (full-text article views including HTML views, PDF and ePub downloads, according to the available data) and Abstracts Views on Vision4Press platform.
Data correspond to usage on the plateform after 2015. The current usage metrics is available 48-96 hours after online publication and is updated daily on week days.
Initial download of the metrics may take a while.