Fig. 7
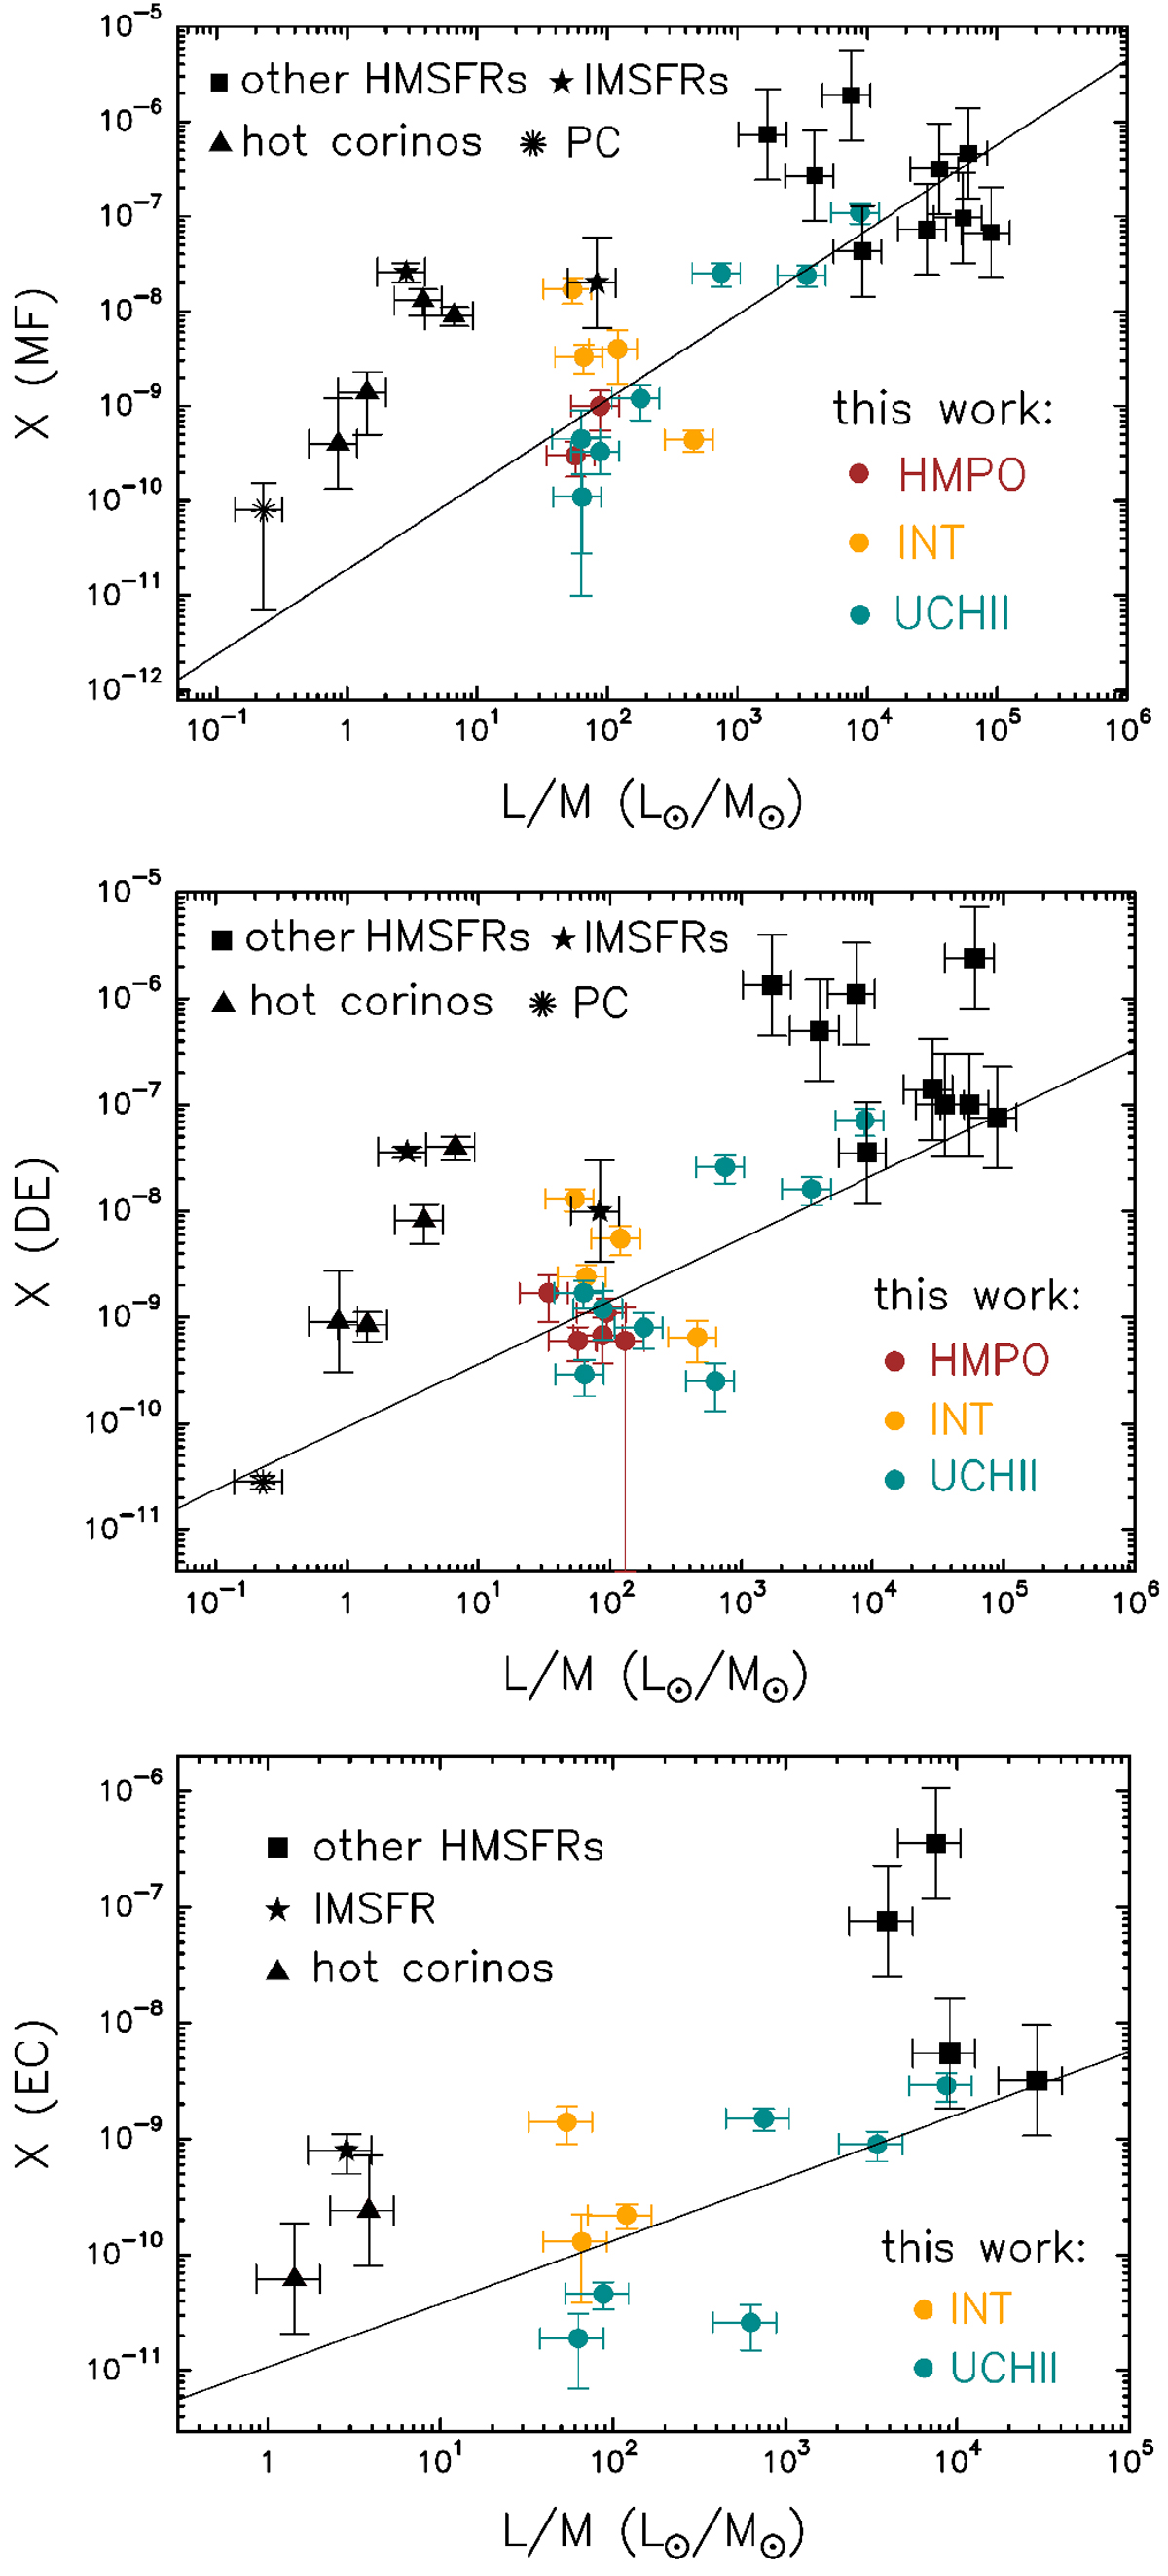
Same as Fig. 6, but for individual molecules MF (upper panel), DE (middle panel), and EC (lower panel). The evolutionary classification is shown for the sources of our sample (different colours), while black symbols represent different interstellar sources taken from literature for comparison (see Table F.1 for references). The black lines fit the data of the sources included in this work.
Current usage metrics show cumulative count of Article Views (full-text article views including HTML views, PDF and ePub downloads, according to the available data) and Abstracts Views on Vision4Press platform.
Data correspond to usage on the plateform after 2015. The current usage metrics is available 48-96 hours after online publication and is updated daily on week days.
Initial download of the metrics may take a while.