Fig. 5
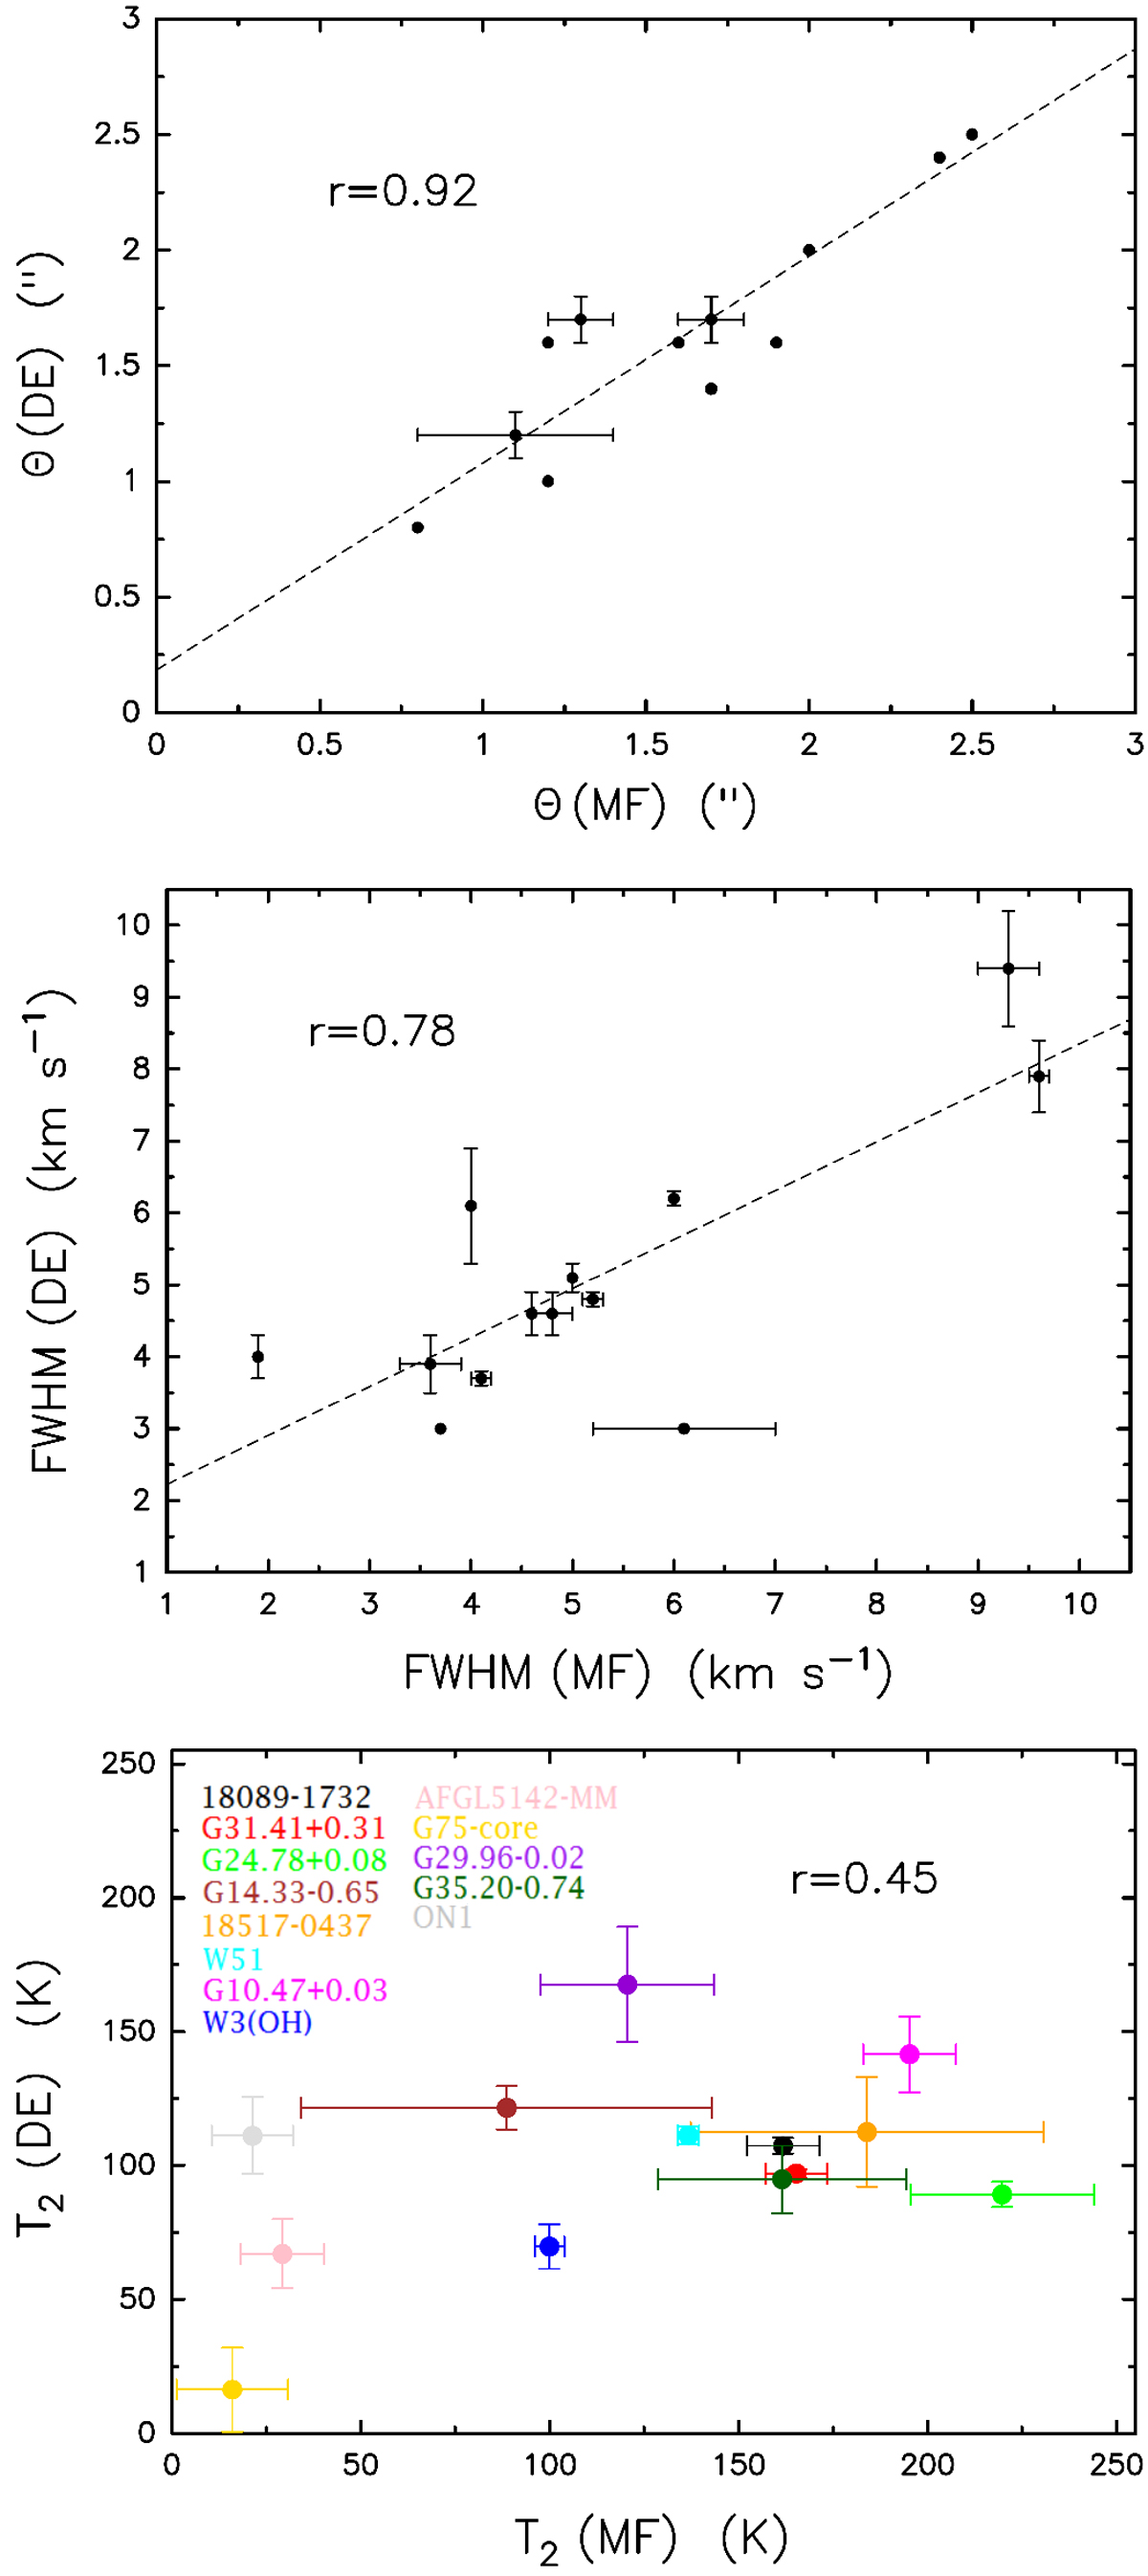
Comparison between the source angular sizes (θ, upper panel,listed in Table 4), the FWHM of the lines (middle panel, Table 5), and the excitation temperatures (T2, lower panel, Table C.1) of MF and DE, obtained with the molecular line fitting procedure at 2 mm. The dashed lines are the linear best-fits to the data. The linear correlation coefficient (r) is also given. Values without error come from fits performed with the relative parameter fixed.
Current usage metrics show cumulative count of Article Views (full-text article views including HTML views, PDF and ePub downloads, according to the available data) and Abstracts Views on Vision4Press platform.
Data correspond to usage on the plateform after 2015. The current usage metrics is available 48-96 hours after online publication and is updated daily on week days.
Initial download of the metrics may take a while.