Fig. 3
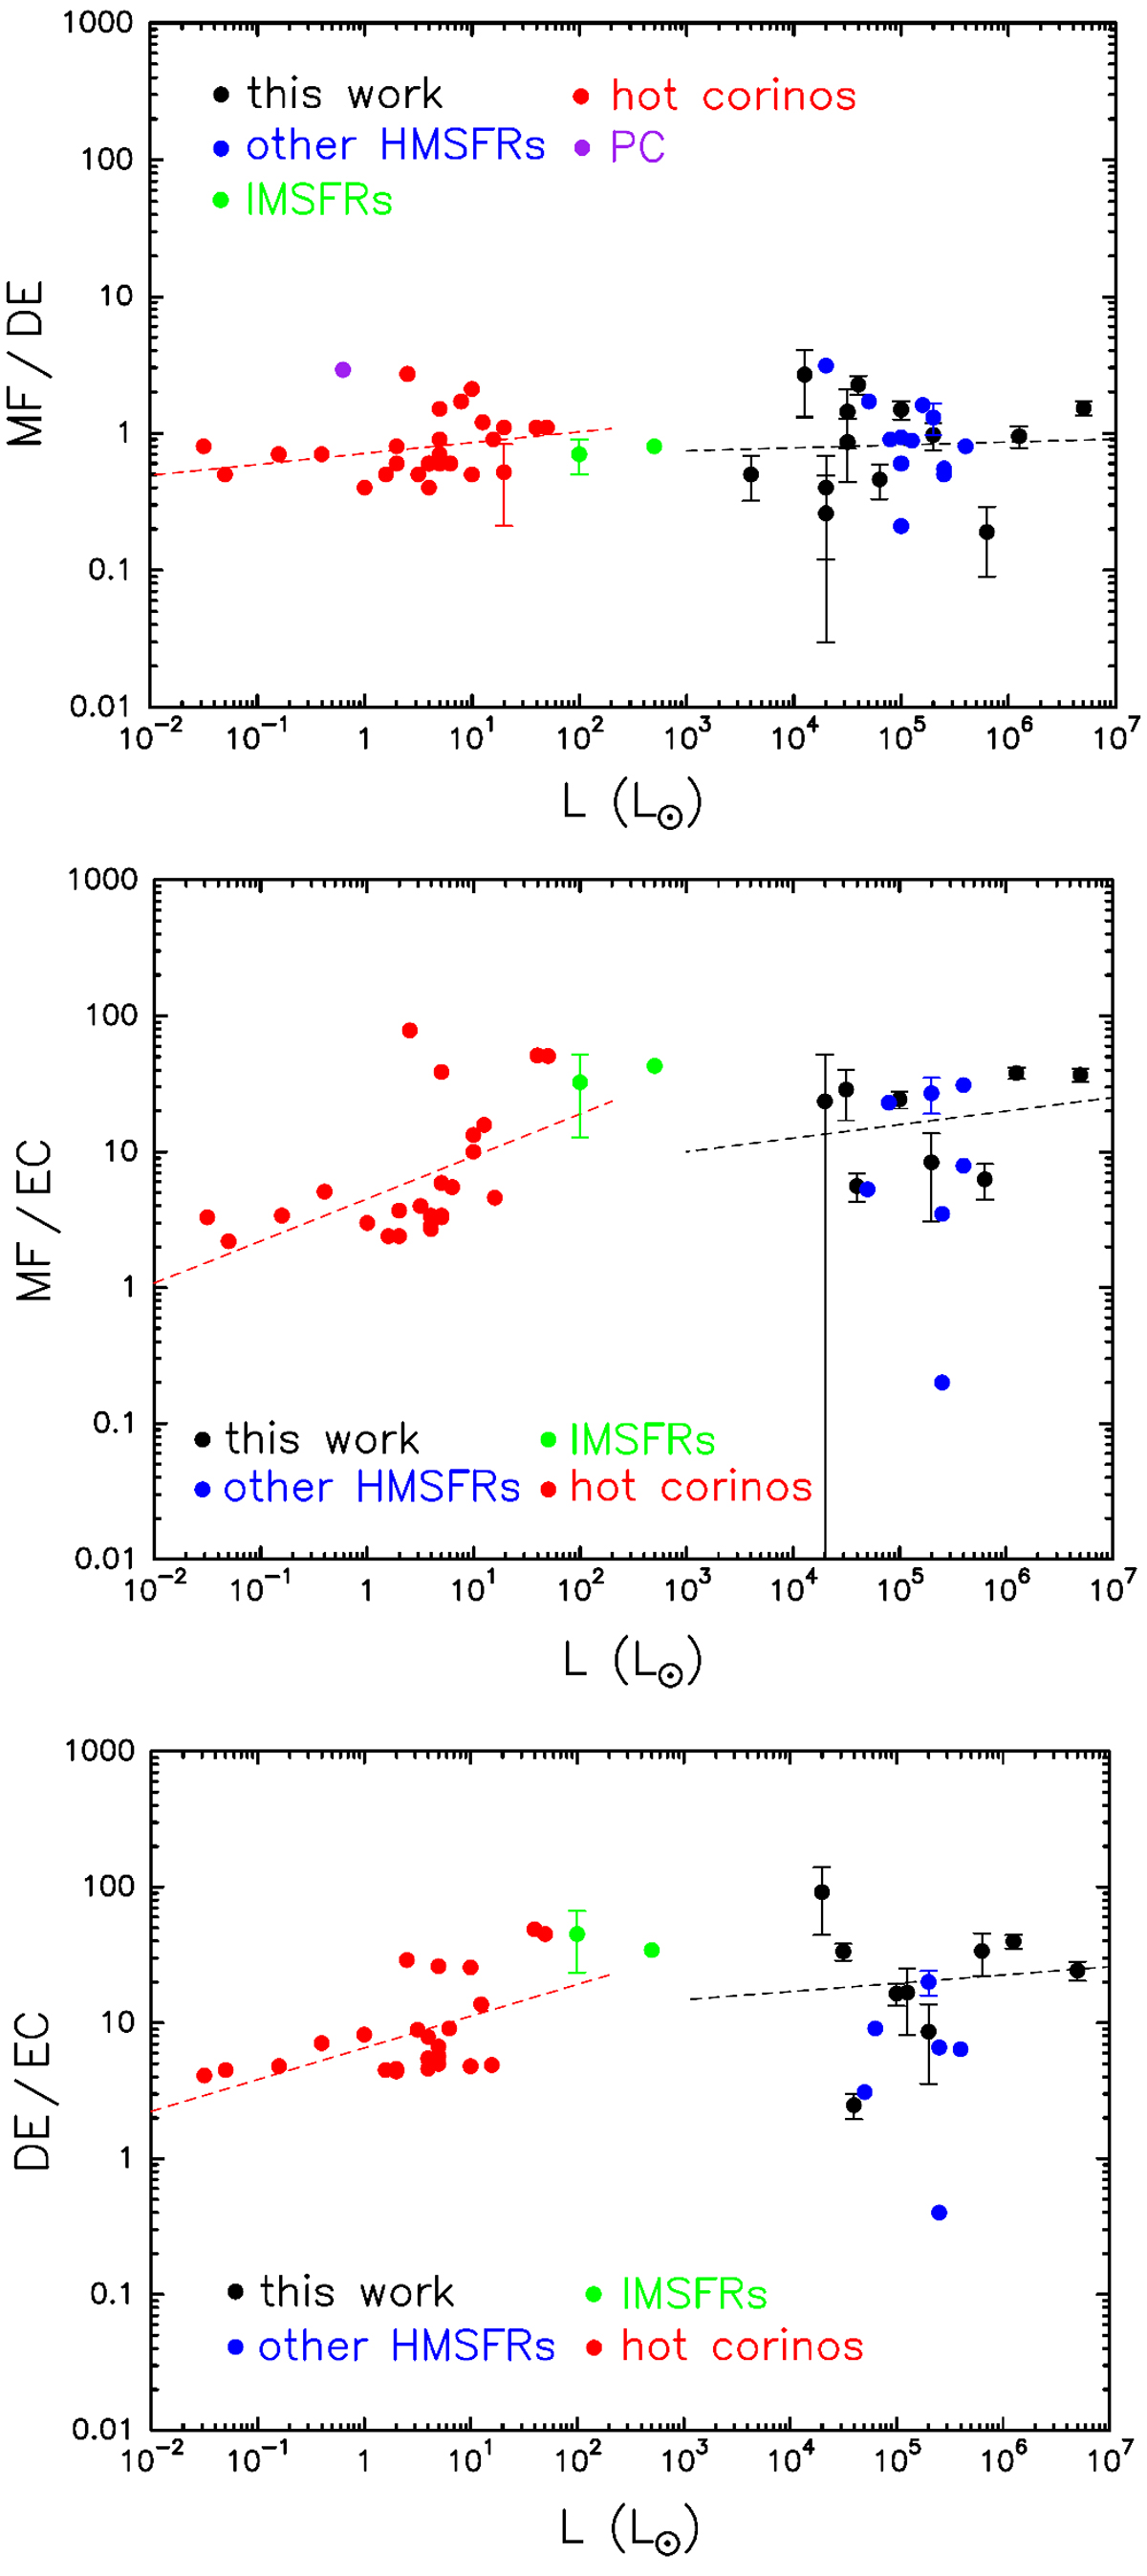
Molecular ratios MF/DE (upper panel), MF/EC (middle panel), and DE/EC (lower panel) as a function of the luminosity of the sources. The results found in this work (Table 11, black circles) are compared with a sample of different star-forming regions from literature (non-black coloured circles, see Table F.1 for references). Error bars are shown when available. The dashed black and red lines are the linear best-fits to the data of the sources included in this work and the hot corinos, respectively. For MF/EC, the large error bar of the lowest luminosity source of our sample (G14.33-0.65) results from the propagation of the high uncertainties of the individual column densities.
Current usage metrics show cumulative count of Article Views (full-text article views including HTML views, PDF and ePub downloads, according to the available data) and Abstracts Views on Vision4Press platform.
Data correspond to usage on the plateform after 2015. The current usage metrics is available 48-96 hours after online publication and is updated daily on week days.
Initial download of the metrics may take a while.