Fig. 2
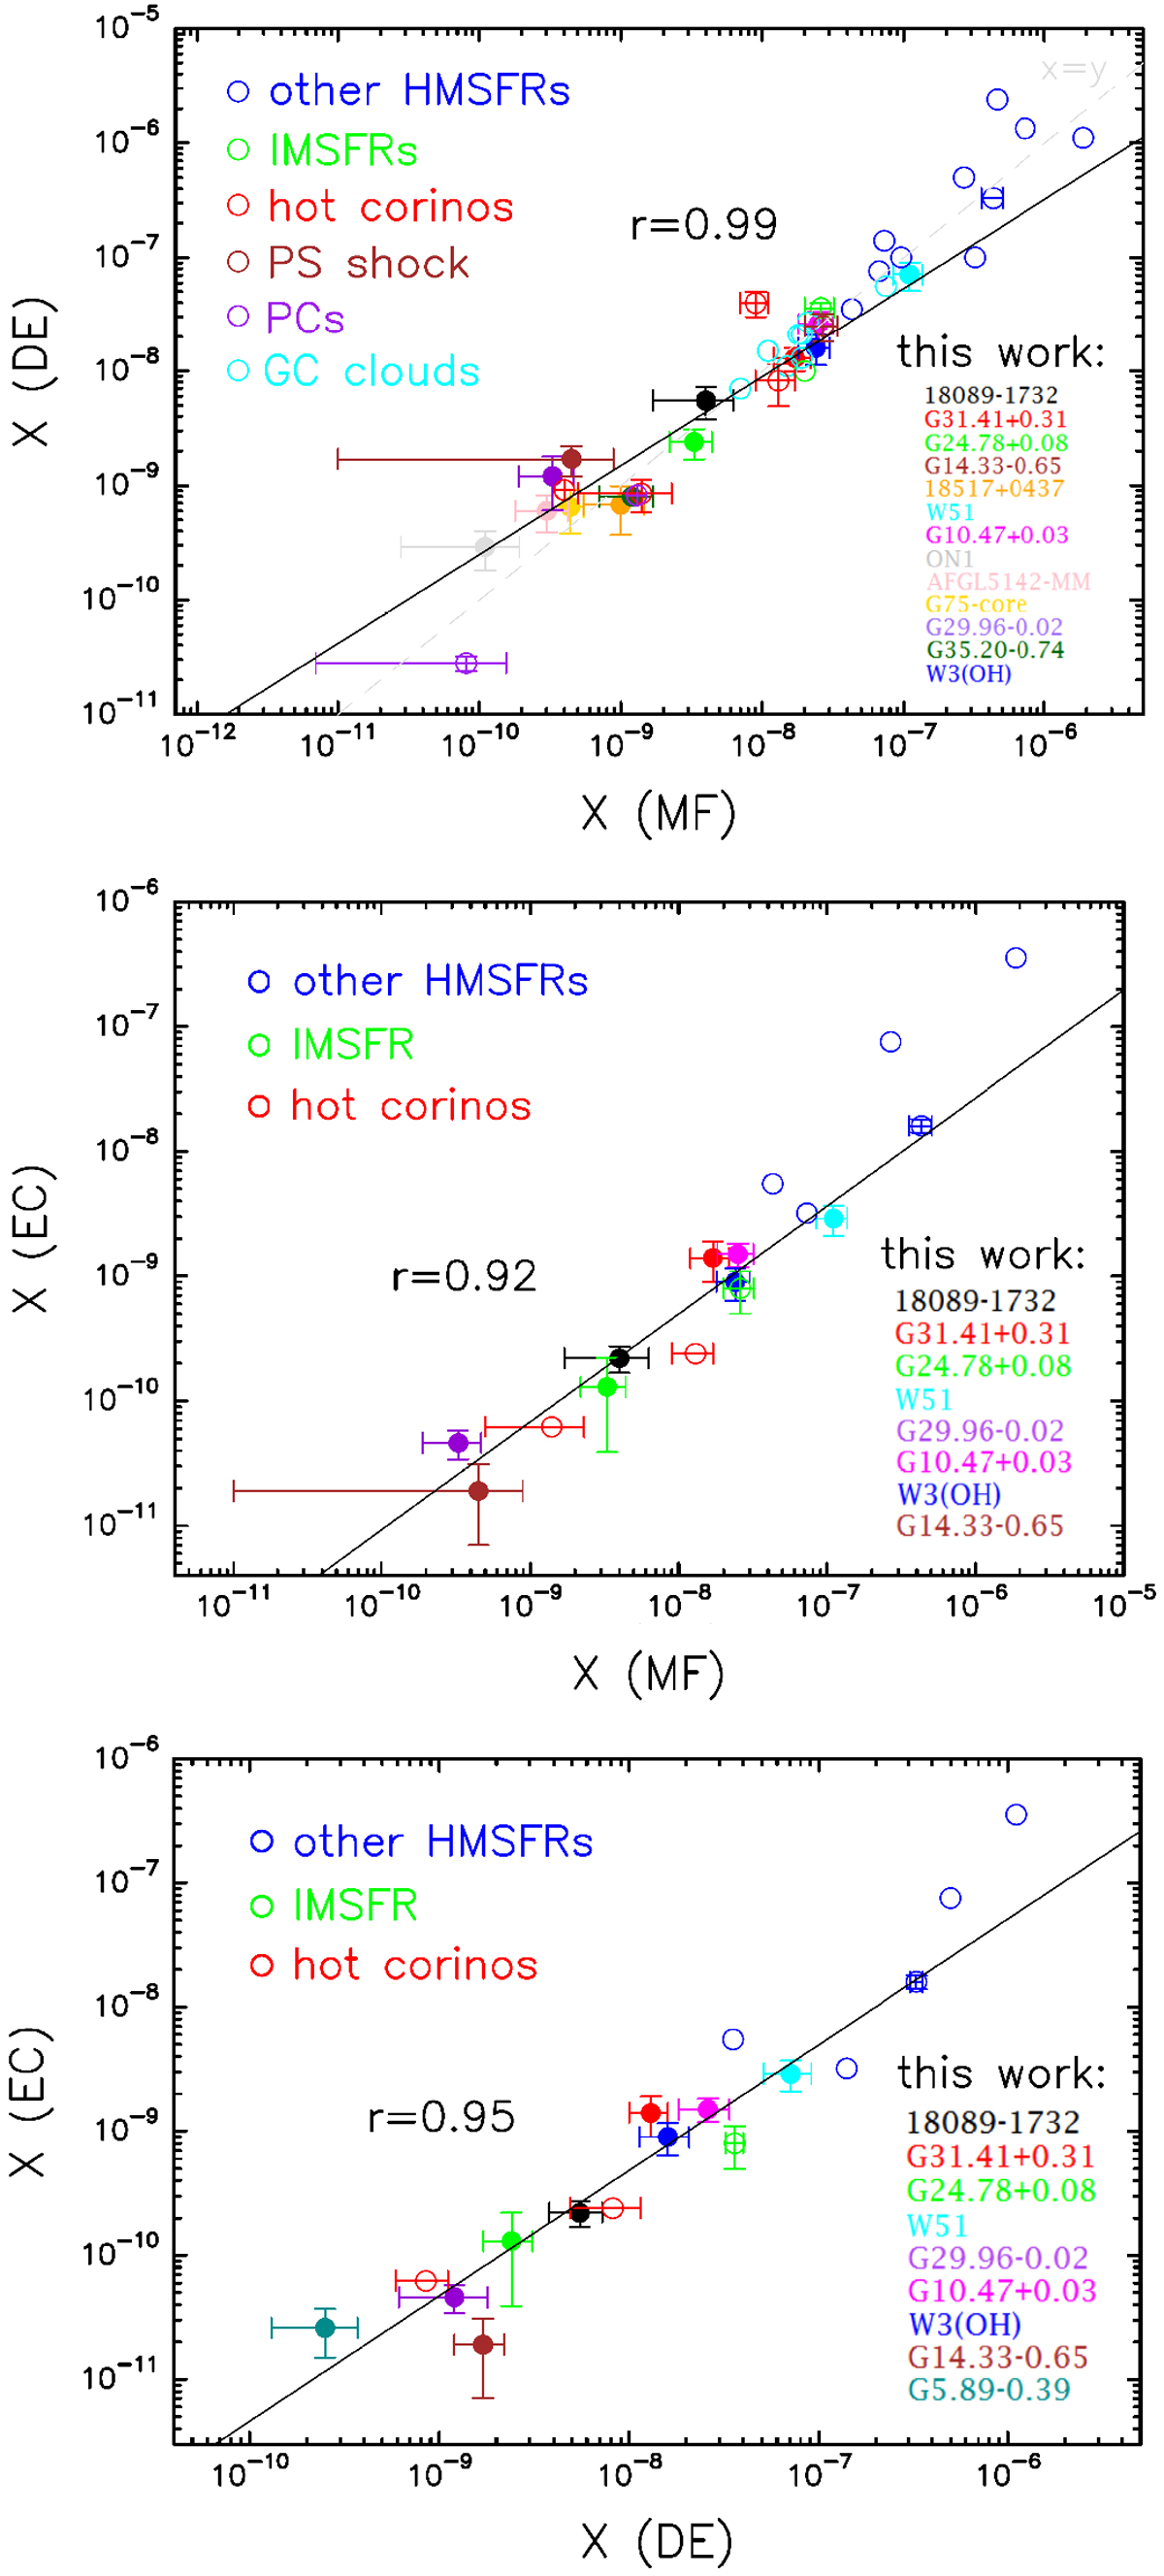
Comparison between the observed molecular abundances (X, Table 10) of MF and DE (upper panel), MF and EC (middle panel), and DE and EC (lower panel). The sources analysed in this work are drawn with filled coloured circles, while literature ones (see Sect. 6.2.1 and Table F.1) with empty coloured circles. All abundances are relative to H2. Error bars are shown whenever available. The solid black line corresponds to the linear best-fit to the data of the sources studied in this work, while the dashed grey line to the identity. The linear correlation coefficient between the two molecules (r) is also given.
Current usage metrics show cumulative count of Article Views (full-text article views including HTML views, PDF and ePub downloads, according to the available data) and Abstracts Views on Vision4Press platform.
Data correspond to usage on the plateform after 2015. The current usage metrics is available 48-96 hours after online publication and is updated daily on week days.
Initial download of the metrics may take a while.