Fig. E.2
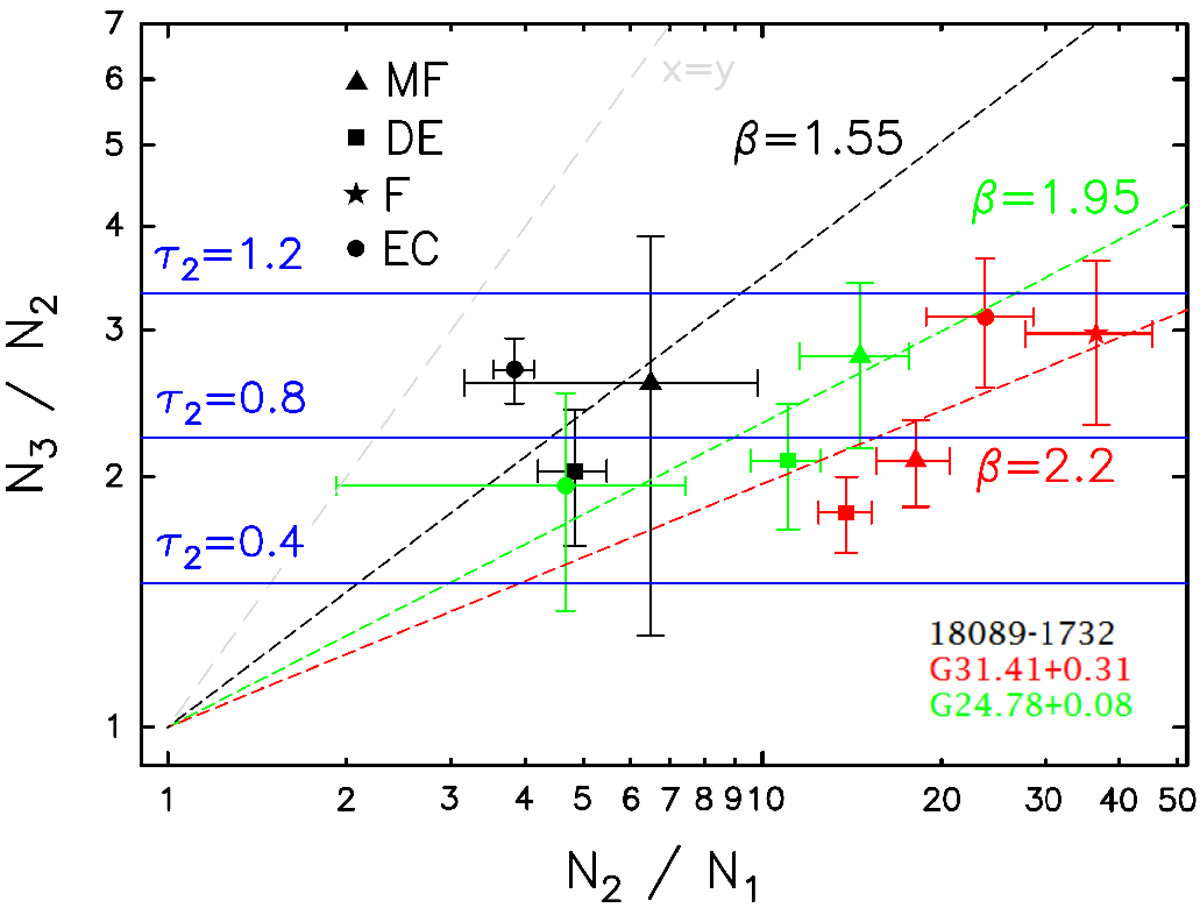
Comparison between the column density ratios N2∕N1 and N3 ∕N2 of MF (triangles), DE (squares), F (star), and EC (circles) in the sources 18089–1732 (black data points), G24.78+0.08 (green), and G31.41+0.31 (red). The dashed coloured lines are the power regression fits to the data of each source, and identify the related β (see text). The horizontal blue lines correspond to different opacities at 2 mm. The dashed grey line represents the case N2∕N1 = N3∕N2 (i.e. β = 1). For further details on this plot see Appendix E.2.
Current usage metrics show cumulative count of Article Views (full-text article views including HTML views, PDF and ePub downloads, according to the available data) and Abstracts Views on Vision4Press platform.
Data correspond to usage on the plateform after 2015. The current usage metrics is available 48-96 hours after online publication and is updated daily on week days.
Initial download of the metrics may take a while.