Fig. 9.
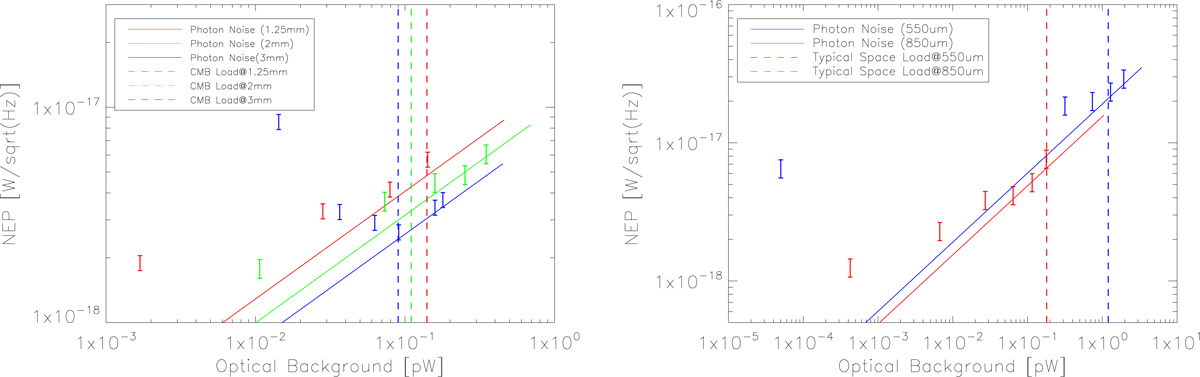
Noise equivalent power (NEP) measured for the 1 mm, 2 mm, and 3 mm arrays. Each point is derived from responsivity and noise measurements for different temperatures of the cold black body. The corresponding optical load per pixel for each temperature is derived using the optical simulation presented in Fig. 2. The vertical dashed lines represent the typical optical background expected from a real instrument operating at second Lagrangian point.
Current usage metrics show cumulative count of Article Views (full-text article views including HTML views, PDF and ePub downloads, according to the available data) and Abstracts Views on Vision4Press platform.
Data correspond to usage on the plateform after 2015. The current usage metrics is available 48-96 hours after online publication and is updated daily on week days.
Initial download of the metrics may take a while.