Fig. 8.
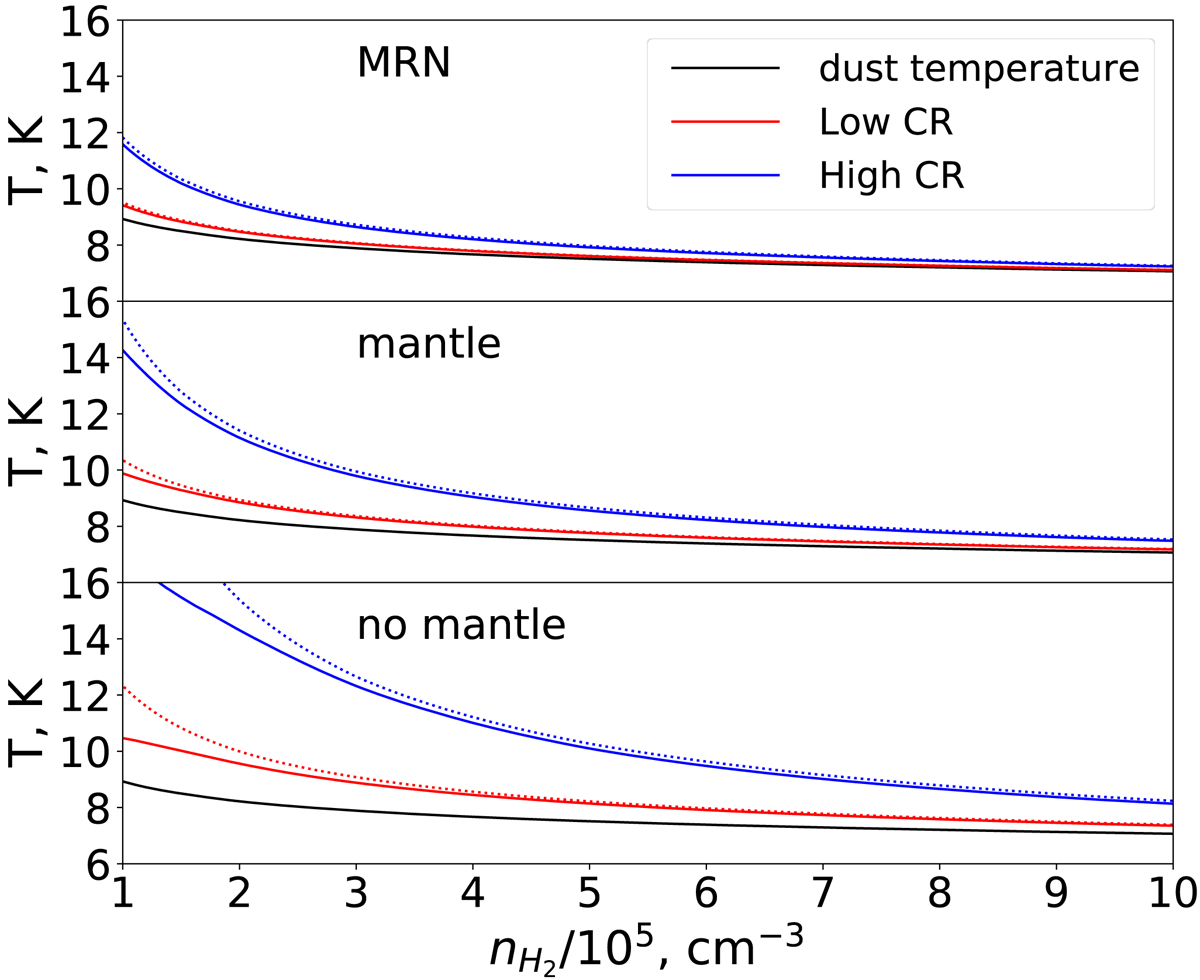
Gas temperature as a function of position within the cloud. Each panel corresponds to a different dust coagulation model, as labeled. The black curve shows the dust temperature, as determined from the radiative transfer model. The blue and red curves show the gas temperature assuming the high and low CR ionization rates, respectively, from Padovani et al. (2018). The solid lines are the full cooling model, and the dashed lines correspond to the dust-only cooling model in Ivlev et al. (2019).
Current usage metrics show cumulative count of Article Views (full-text article views including HTML views, PDF and ePub downloads, according to the available data) and Abstracts Views on Vision4Press platform.
Data correspond to usage on the plateform after 2015. The current usage metrics is available 48-96 hours after online publication and is updated daily on week days.
Initial download of the metrics may take a while.