Fig. 7.
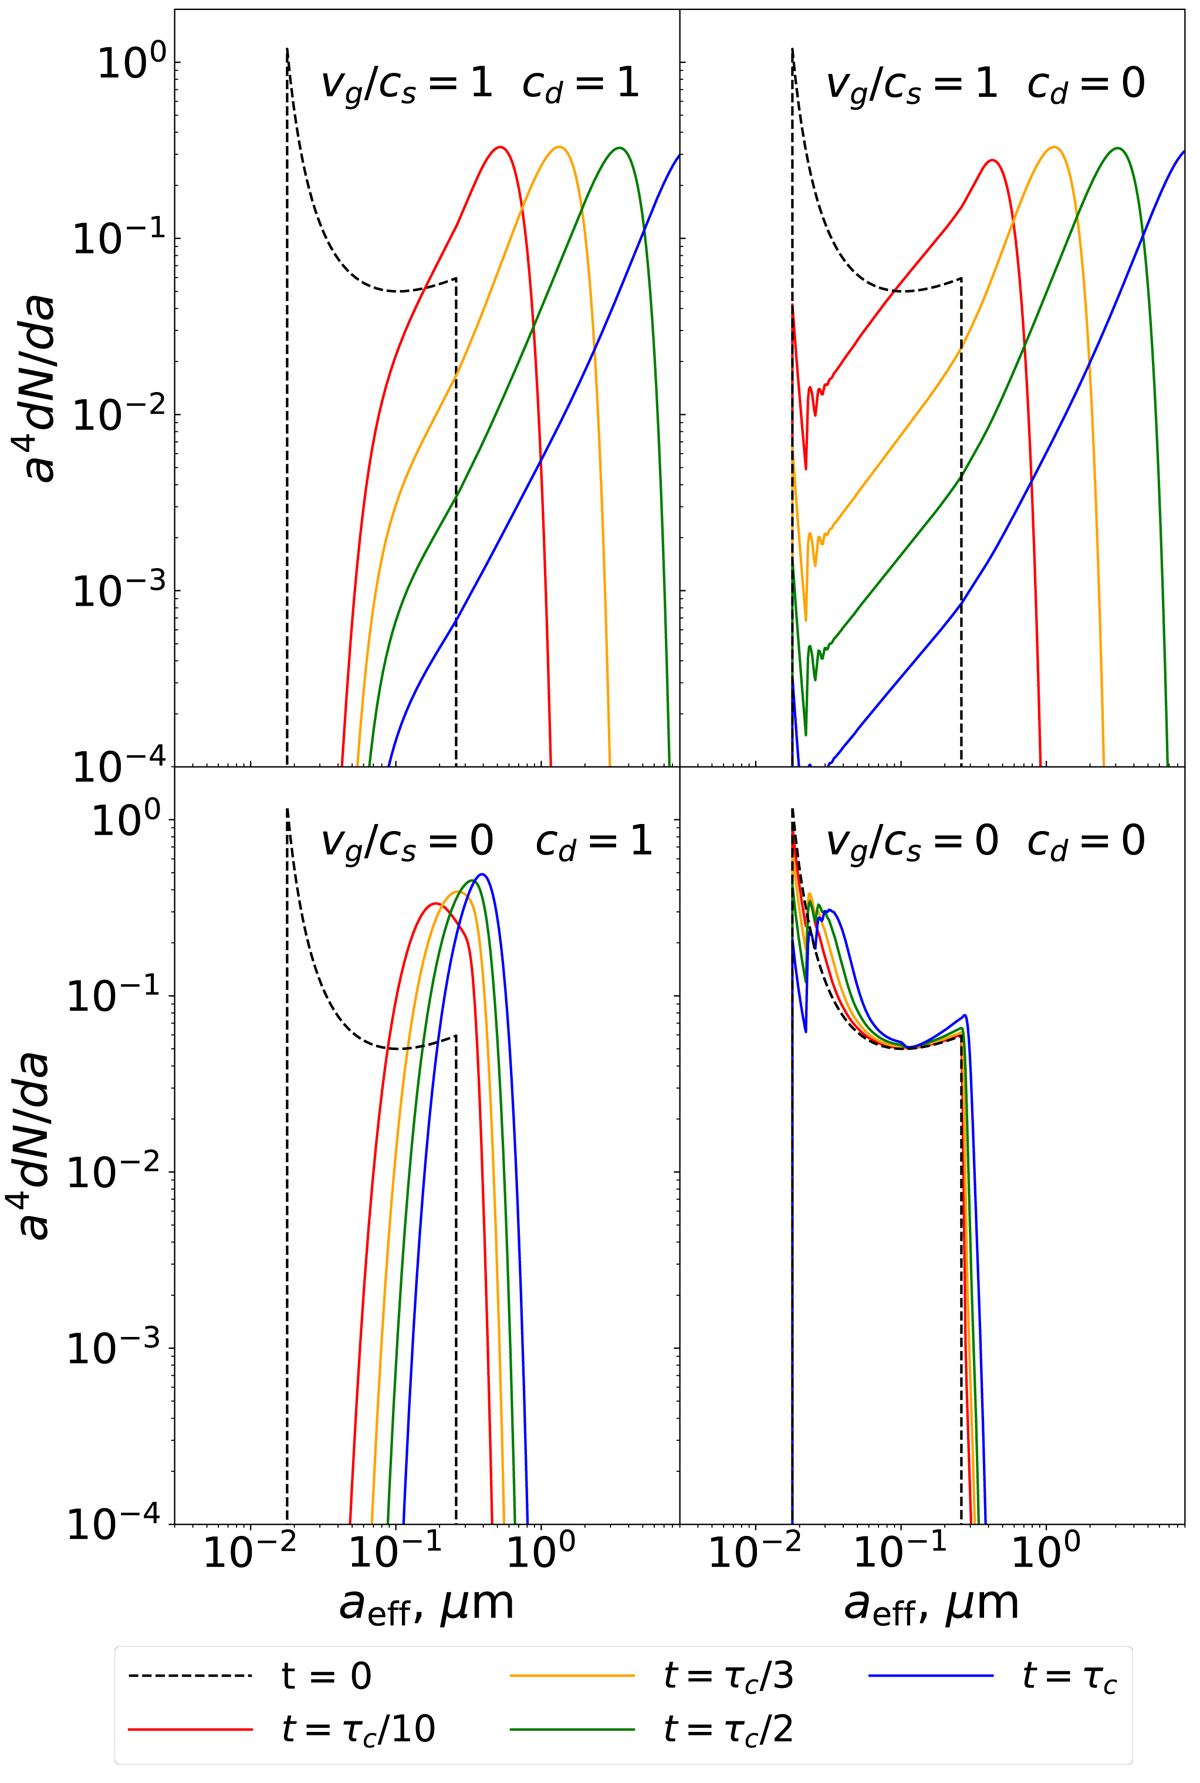
Same as Fig. 4, but assuming that grains are covered with icy mantles, and that they are non-spherical and/or porous (which increases their projected surface area by a factor of 2). As in Fig. 4, the panels show different degrees of turbulence and ambipolar diffusion, parameterized by vg and cd, as labeled. The sharp peak around 20 nm is the result of the assumption that mantles of equal thickness were applied to all the grains in the MRN distribution. Different ways of assigning the mantle volume do not appreciably alter the results at later times. The wiggles seen in some of the curves near 20 nm are a simulation effect to do with the sharp cutoff of the initial mass distribution and the finite bin width.
Current usage metrics show cumulative count of Article Views (full-text article views including HTML views, PDF and ePub downloads, according to the available data) and Abstracts Views on Vision4Press platform.
Data correspond to usage on the plateform after 2015. The current usage metrics is available 48-96 hours after online publication and is updated daily on week days.
Initial download of the metrics may take a while.