Fig. 6.
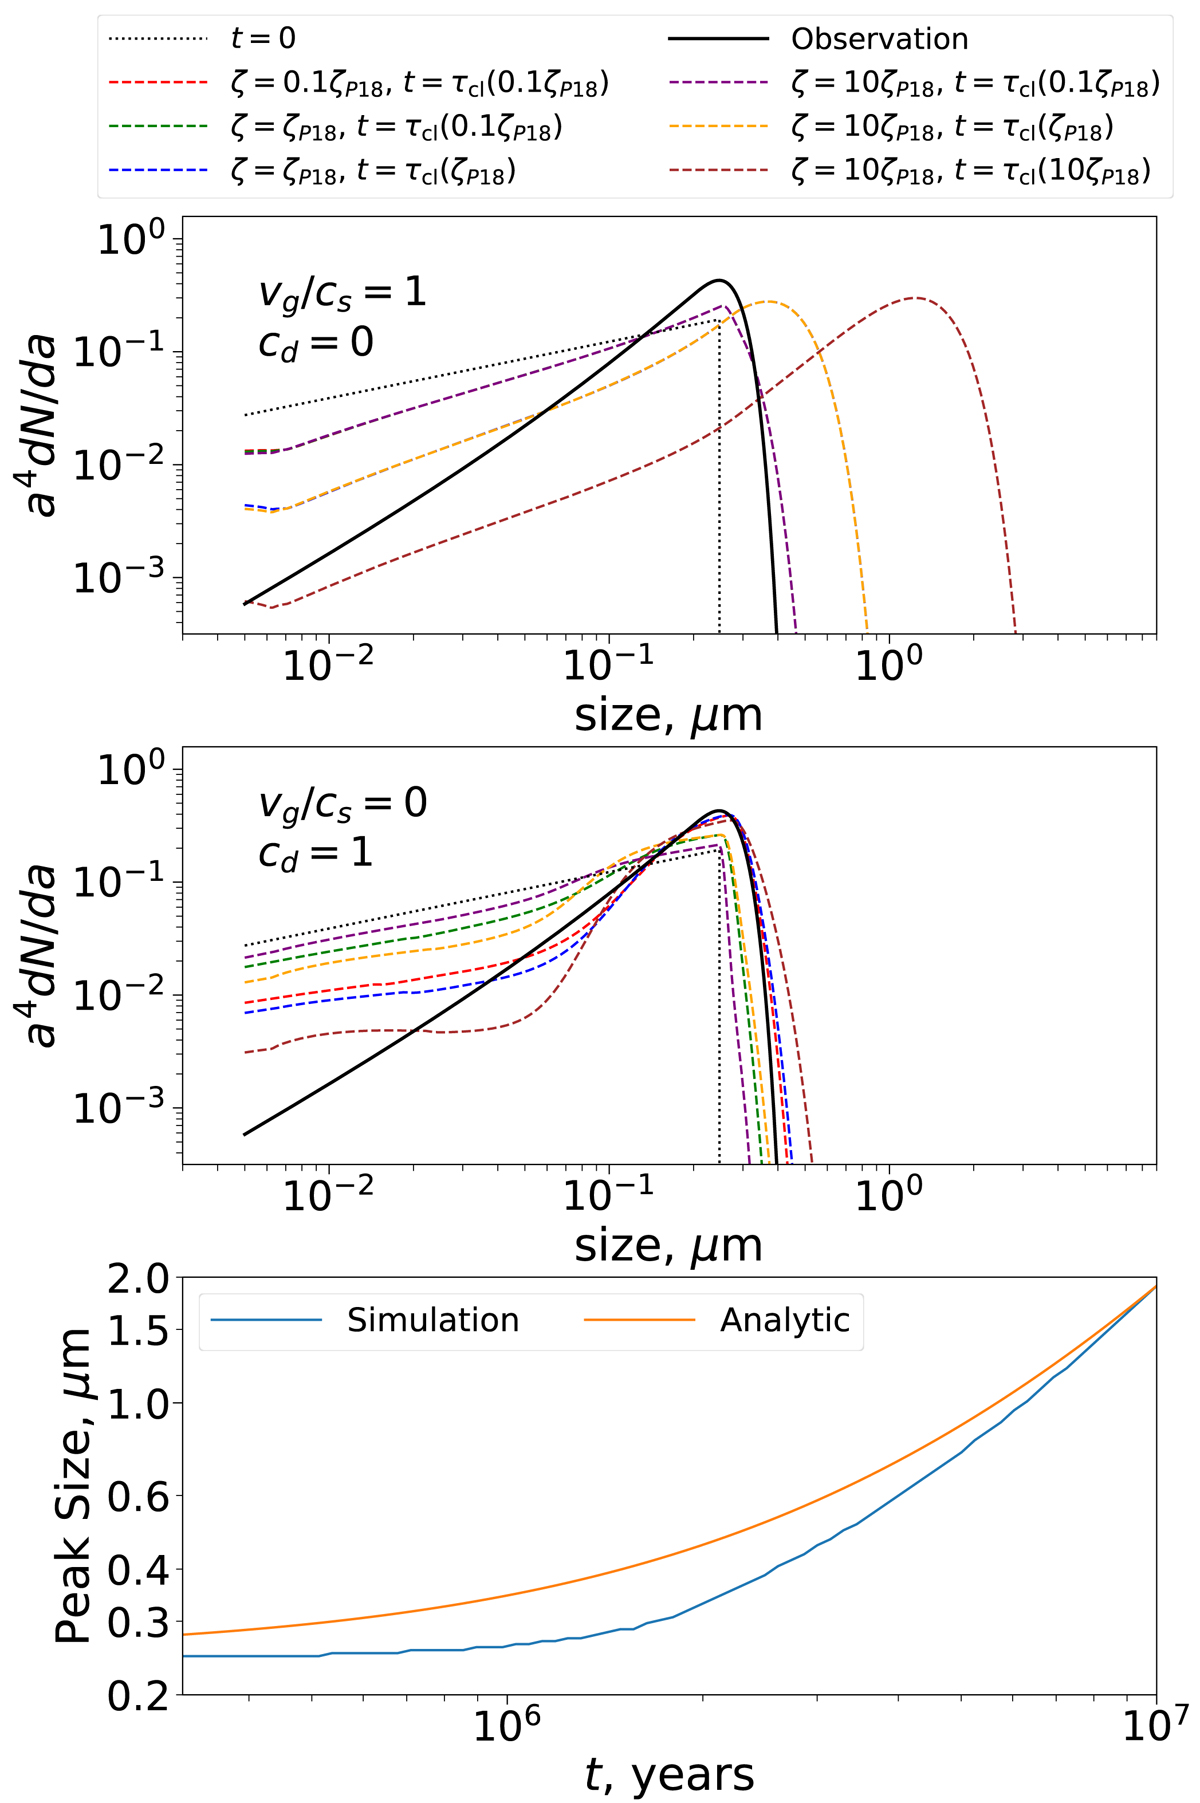
Top panel: size distribution in the envelope for the case with sonic turbulence and cd = 0. The different curves correspond to different amounts of time and different CR rates (see legend at top). Time is expressed in terms of τcl for each different CR ionization rate. τcl(0.1ζP18), τcl(ζP18), and τcl(10ζP18) are the cloud lifetimes, evaluated assuming CR ionization rates of 0.1ζP18, ζP18, and 10ζP18, respectively, where ζP18 is the ionization rate calculated from Padovani et al. (2018). In the case of cd = 0 (top panel) the curves at different times are nearly independent of the ionization rate and the curves overlap nearly perfectly (i.e., only one curve is visible for each time). Middle panel: without turbulence, but assuming cd = 1. Bottom panel: shown in blue is the peak of the distribution as a function of time (assuming ζ = ζP18, cd = 0, and vg = cs), and in orange the approximation given by Eq. (23).
Current usage metrics show cumulative count of Article Views (full-text article views including HTML views, PDF and ePub downloads, according to the available data) and Abstracts Views on Vision4Press platform.
Data correspond to usage on the plateform after 2015. The current usage metrics is available 48-96 hours after online publication and is updated daily on week days.
Initial download of the metrics may take a while.