Open Access
Fig. 5.
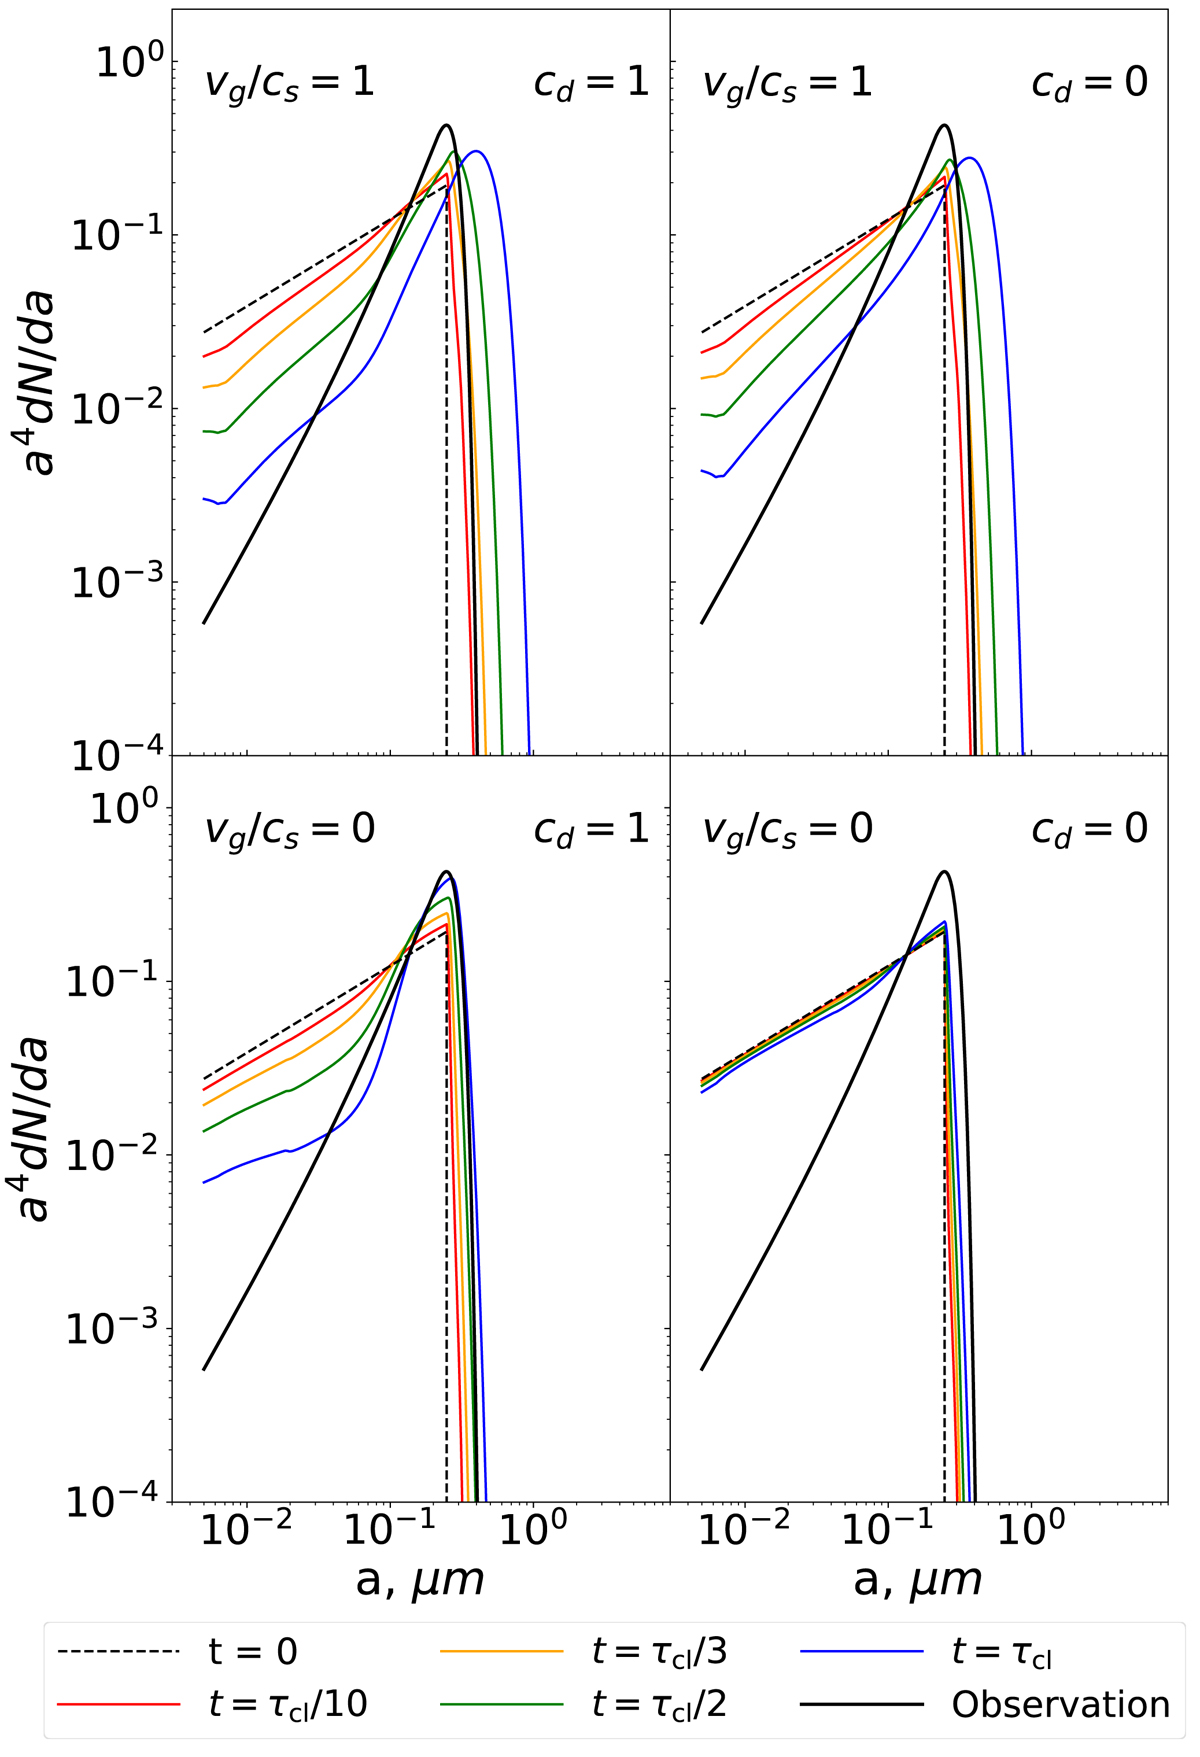
Same as Fig. 4, but for the envelope. The colored curves show the size distribution at different times. In this case τcl = 2.3 × 10⁶ years. The black solid line shows the curve inferred in Weingartner & Draine (2001) for dense regions.
Current usage metrics show cumulative count of Article Views (full-text article views including HTML views, PDF and ePub downloads, according to the available data) and Abstracts Views on Vision4Press platform.
Data correspond to usage on the plateform after 2015. The current usage metrics is available 48-96 hours after online publication and is updated daily on week days.
Initial download of the metrics may take a while.