Fig. 4.
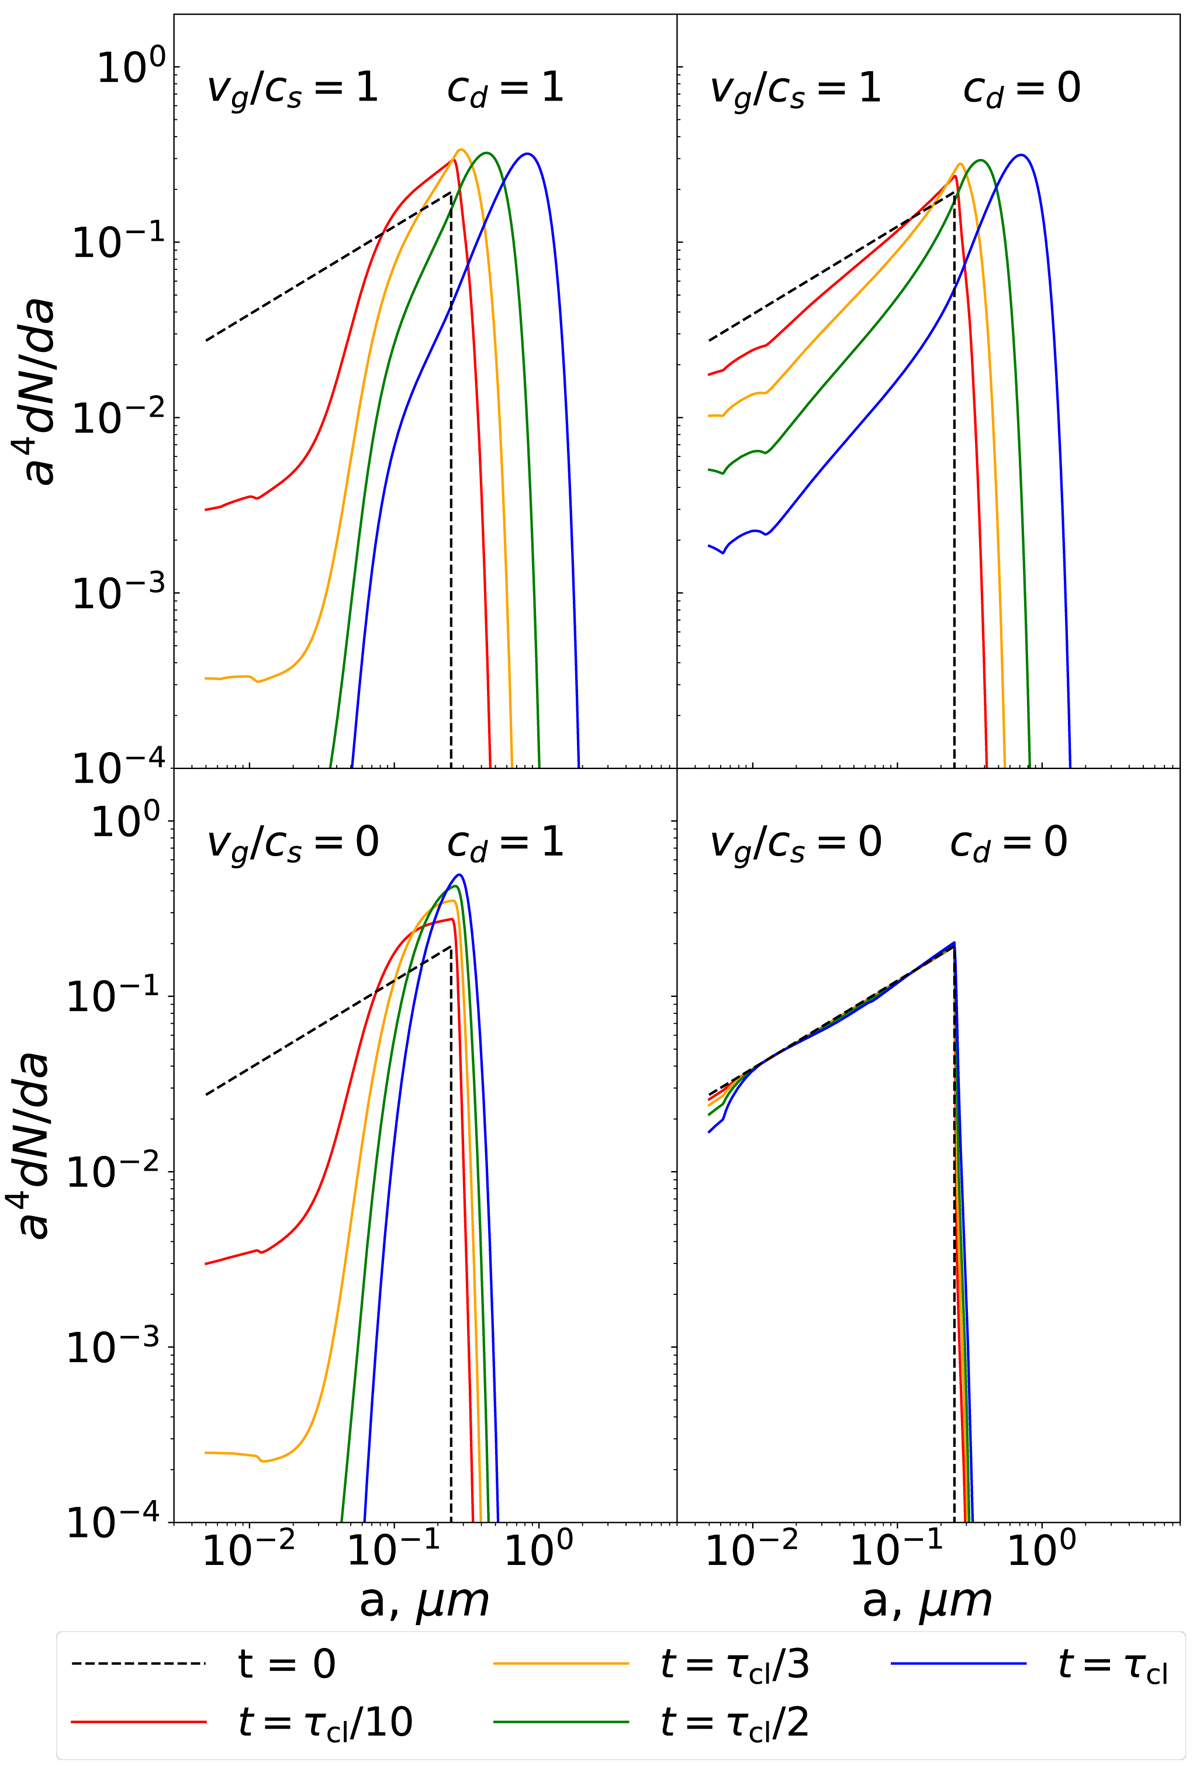
Evolution of the grain-size distribution in the core center for different values of the parameters vg and cd, as labeled in the panels. The different color curves correspond to different amounts of time the simulation was run for in terms of the cloud lifetime τcl (see Eq. (15)). Here τcl = 2.6 × 10⁵ years. In each case the initial distribution is an MRN distribution from 5 to 250 nm, which is shown as the black dashed line.
Current usage metrics show cumulative count of Article Views (full-text article views including HTML views, PDF and ePub downloads, according to the available data) and Abstracts Views on Vision4Press platform.
Data correspond to usage on the plateform after 2015. The current usage metrics is available 48-96 hours after online publication and is updated daily on week days.
Initial download of the metrics may take a while.