Fig. 3.
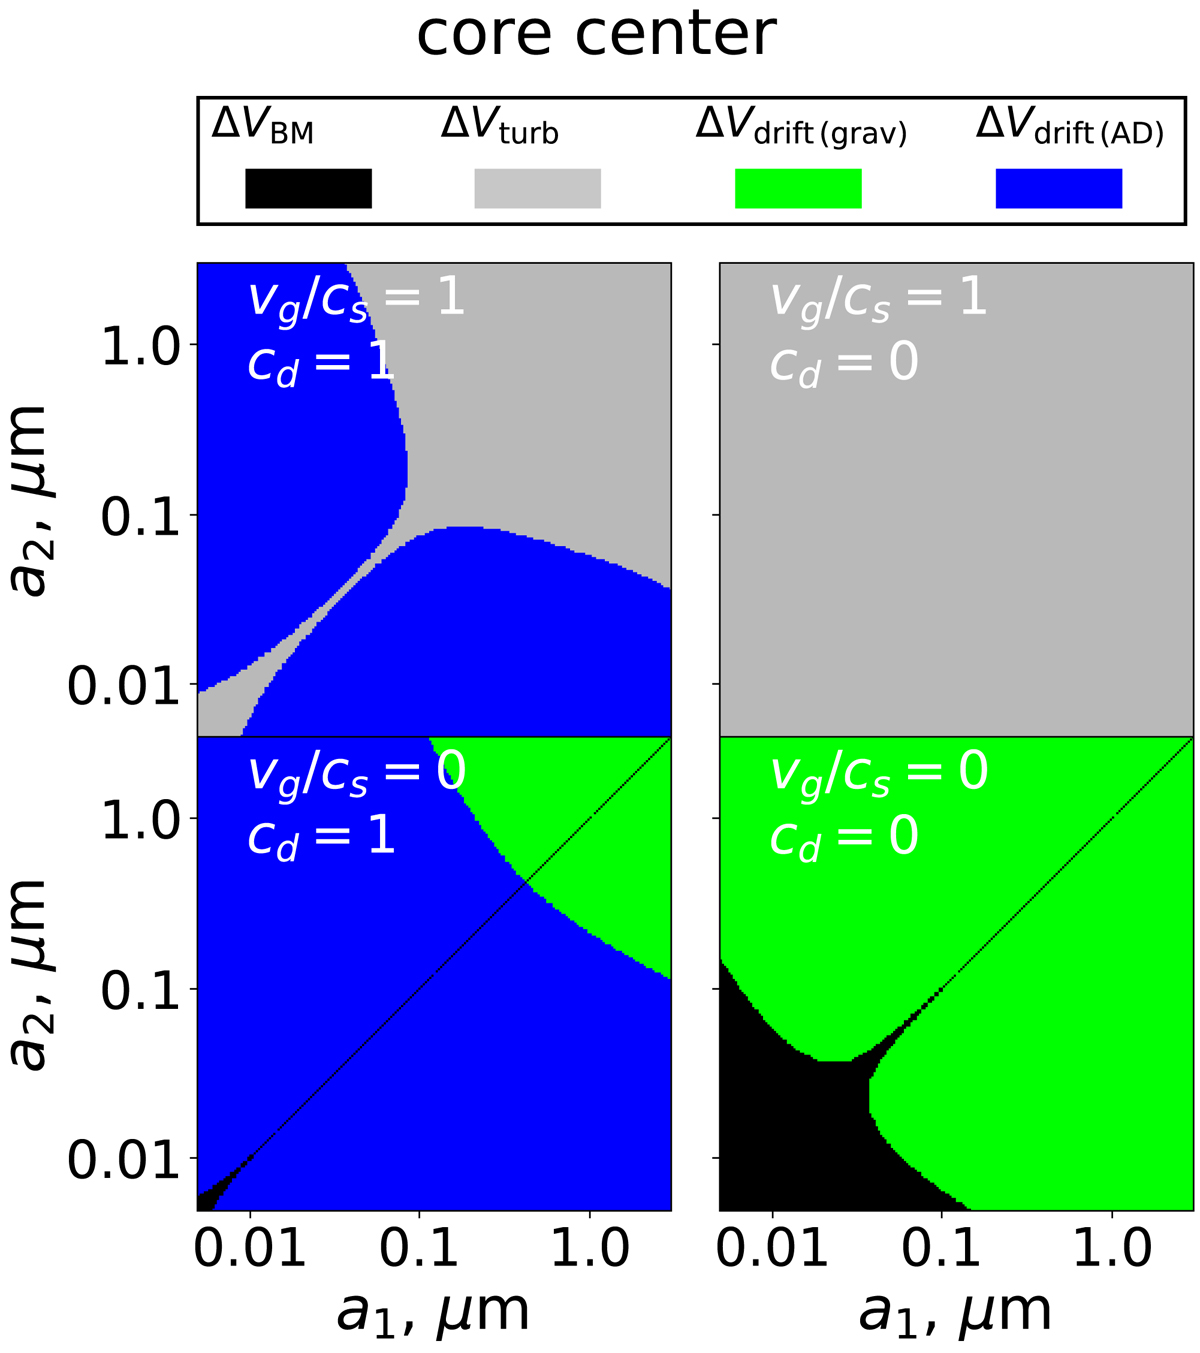
Dominant source of collision velocity in the space of the sizes of the collision partners. The turbulent velocity vg and the constant cd, which describes the speed of the ion-neutral drift (see Eq. (5)), are varied between the panels, as labeled. vg and cd in each panel take the same values as in the corresponding panel of Fig. 2. The mapping between color and dominant velocity source is shown in the legend on top.
Current usage metrics show cumulative count of Article Views (full-text article views including HTML views, PDF and ePub downloads, according to the available data) and Abstracts Views on Vision4Press platform.
Data correspond to usage on the plateform after 2015. The current usage metrics is available 48-96 hours after online publication and is updated daily on week days.
Initial download of the metrics may take a while.