Fig. 4.
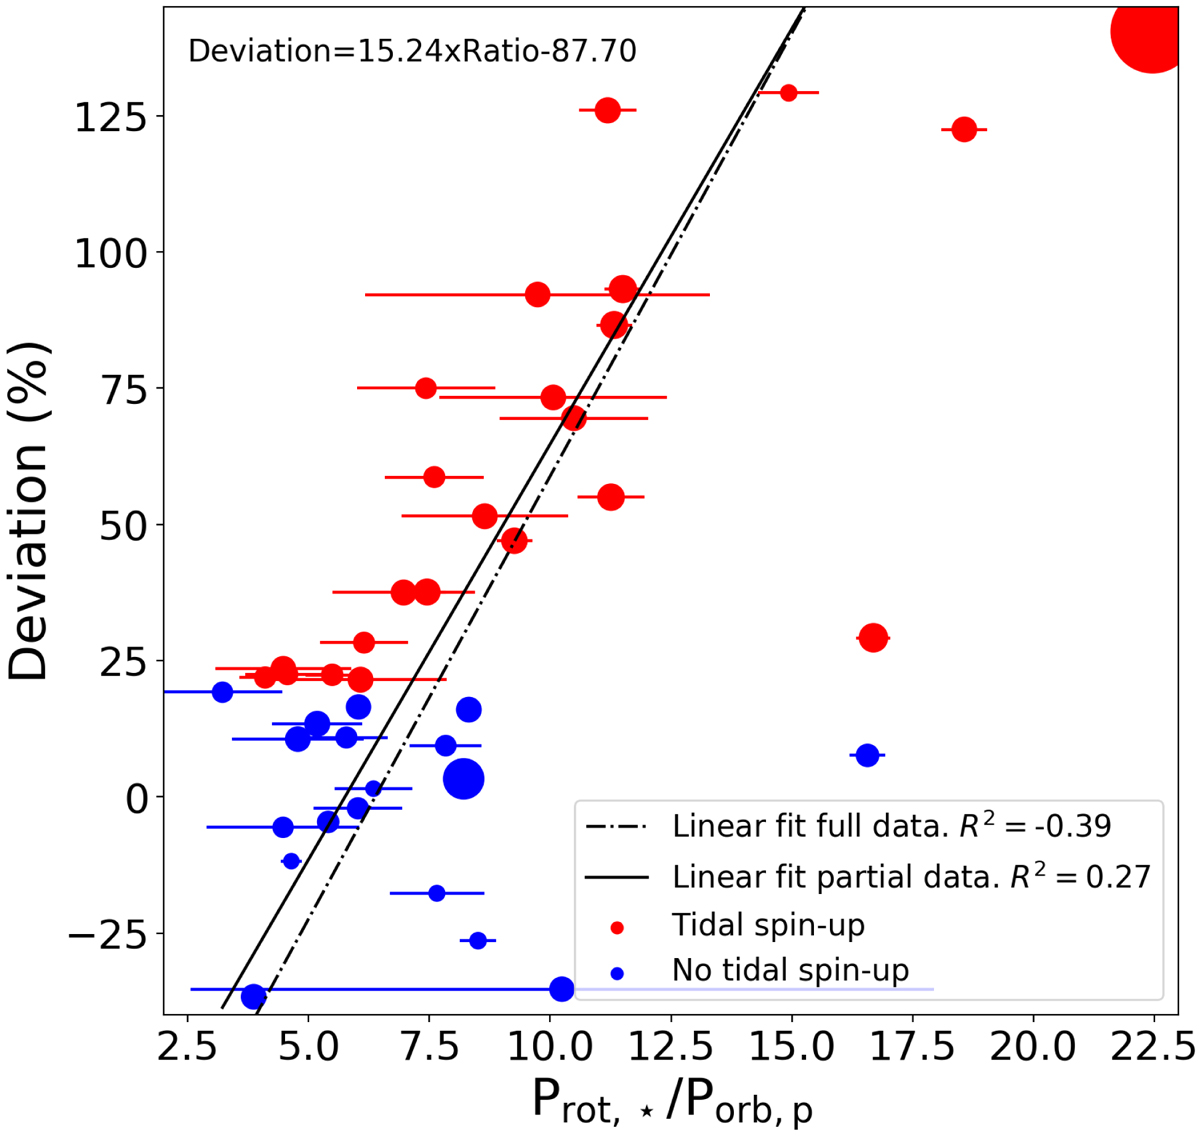
Deviation between tidal-chronology age and gyrochronology age as a function of the ratio Prot, ⋆/Porb, p. The dashed line is a linear fit considering the full dataset. The dash-dotted line is also a linear fit but omitting the WASP-4 and Qatar-1 systems from the dataset. The red dots are the systems for which tidal-spin up is suspected while the blue dots are systems without tidal spin-up. The dashed line corresponds to a linear fit to the full data while the dash-dotted line is a linear fit to the same data but without the WASP-4 and Qatar-1 systems that are located in the lower-right corner of the plot (with a ratio ∼16% and a deviation lower about 7 and 30%, respectively). The size of the points increases for increasing quality factor extracted from Table 1.
Current usage metrics show cumulative count of Article Views (full-text article views including HTML views, PDF and ePub downloads, according to the available data) and Abstracts Views on Vision4Press platform.
Data correspond to usage on the plateform after 2015. The current usage metrics is available 48-96 hours after online publication and is updated daily on week days.
Initial download of the metrics may take a while.