Fig. 4
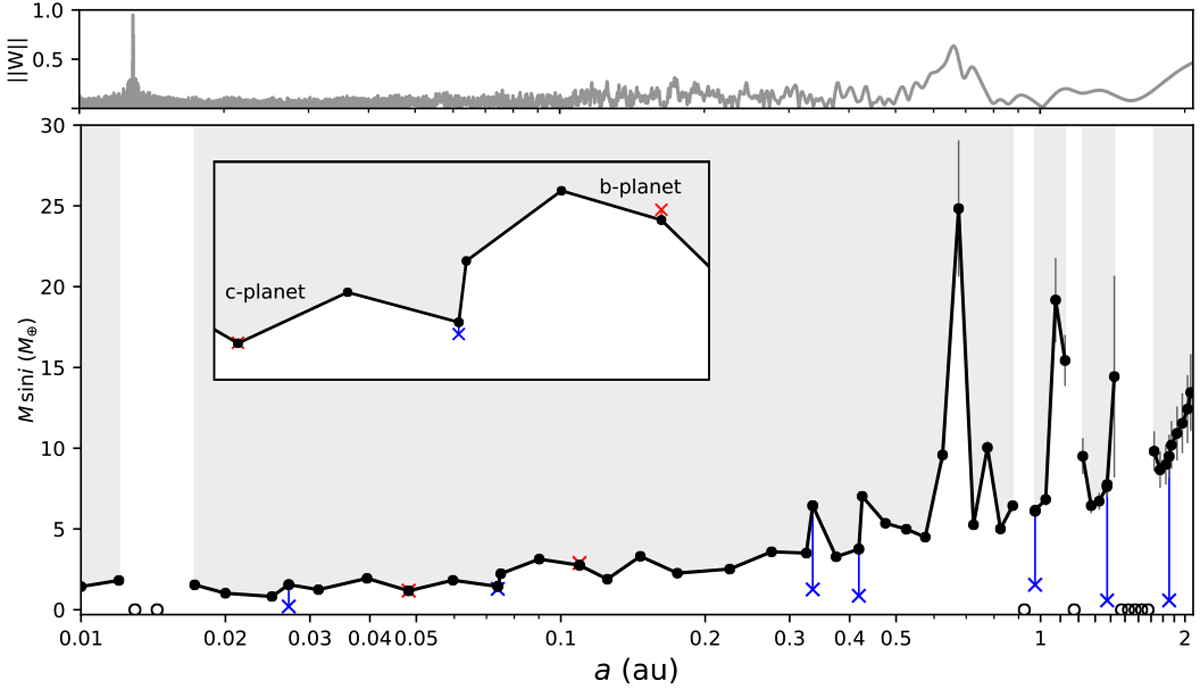
Minimum (lower-limit) masses of the planetary signals depending on their semi-major axes (black dots). Circular orbits were assumed. Only planets within the grey areas could be detected using the HARPS data set that confirmed GJ 273b and GJ 273c. Blue crosses, which correspond to the masses of the hypothetical planets predicted by the dynamical models (see last panel of Fig. 2) are belowthis detection threshold. The inset shows a close-up of the GJ 273b and GJ 273c analogues predicted by the dynamical models. The minimum GJ 273b and GJ 273c masses reported by Astudillo-Defru et al. (2017b) are highlighted with red crosses and appear on or above the detection threshold. Open circles indicate experiments for which 90% completeness was not reached even when running the experiments with Ki up to 6.75 ms−1. They correspond to high power regions of the spectral window shown in the top panel.
Current usage metrics show cumulative count of Article Views (full-text article views including HTML views, PDF and ePub downloads, according to the available data) and Abstracts Views on Vision4Press platform.
Data correspond to usage on the plateform after 2015. The current usage metrics is available 48-96 hours after online publication and is updated daily on week days.
Initial download of the metrics may take a while.