Fig. 3
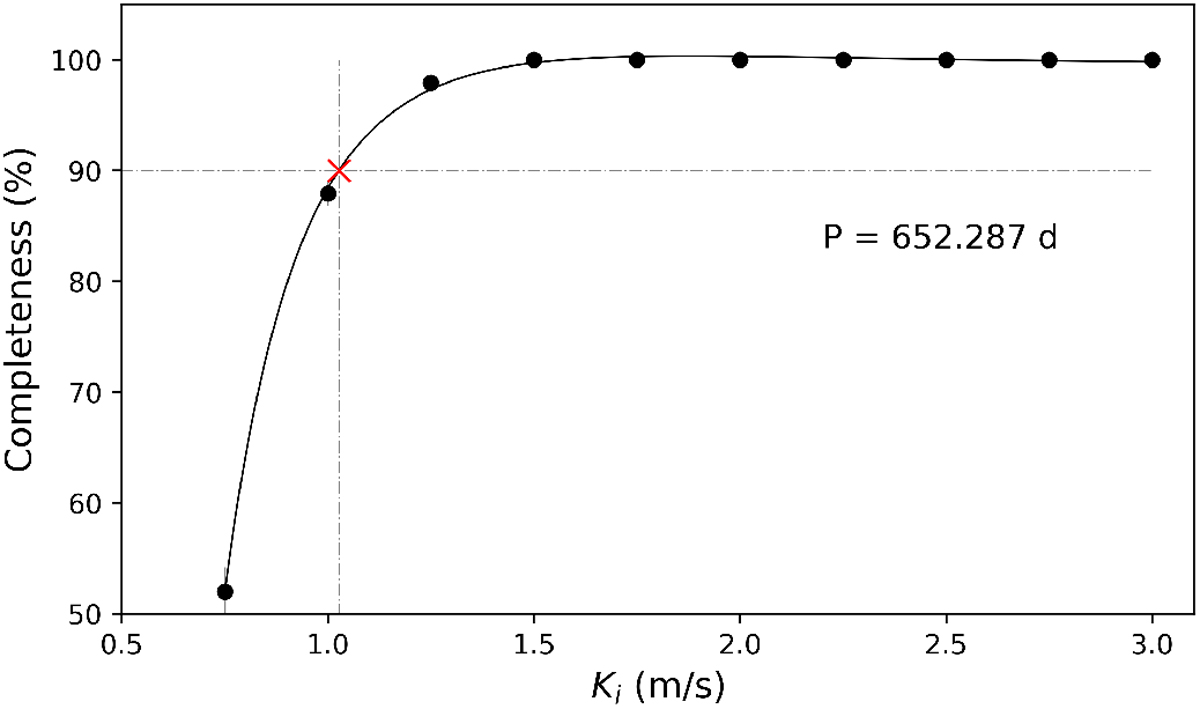
Percentage of well-detected sinusoids from a total of N = 1000 experiments (i.e. completeness, C) versus the initial amplitude. The case of simulated sinusoids with P = 652.3 d is illustrated here as an example of how the C is calculate. The black line indicates the polynomial model fitted to get the initial amplitude (Ki) that corresponds to a 90% completeness (red cross).
Current usage metrics show cumulative count of Article Views (full-text article views including HTML views, PDF and ePub downloads, according to the available data) and Abstracts Views on Vision4Press platform.
Data correspond to usage on the plateform after 2015. The current usage metrics is available 48-96 hours after online publication and is updated daily on week days.
Initial download of the metrics may take a while.