Fig. 2
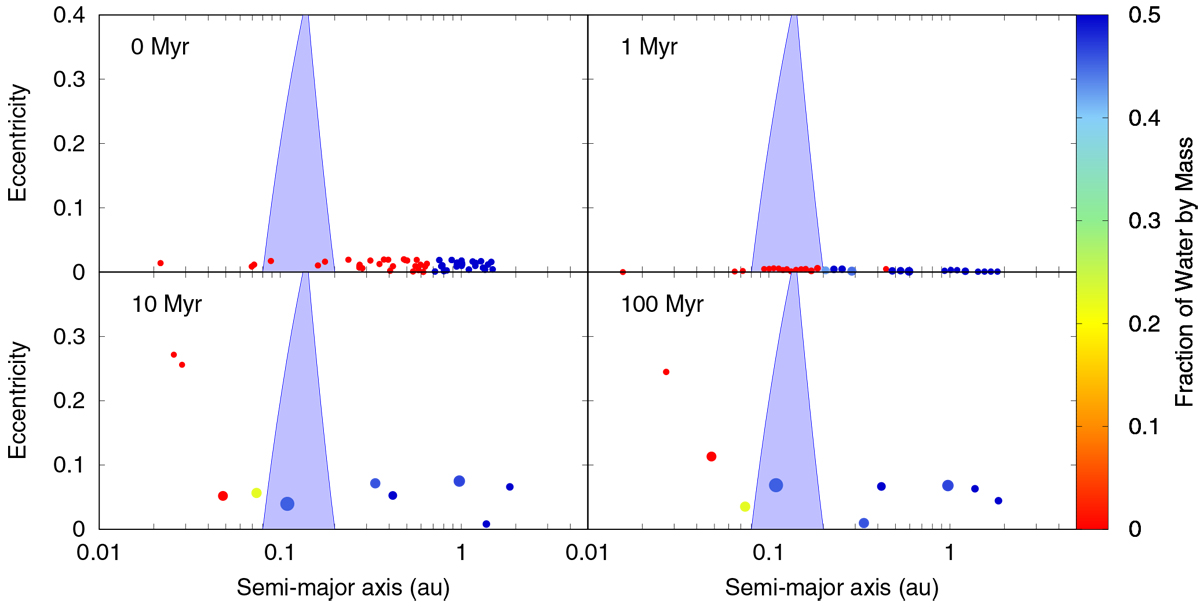
Temporal evolution of semi-major axis as a function of the eccentricity in the “Set 2” N-body simulations, which illustrates the most likely planetary-formation scenario. The planetary embryos (and the resulting planets) are represented by circles, which show a colour code that indicates their fraction of water by mass. The solid blue lines illustrate curves of constant pericentric distance (q = 0.08 au) and apocentric distance (Q = 0.2 au), while the light blue shaded region represents the optimistic HZ of the system.
Current usage metrics show cumulative count of Article Views (full-text article views including HTML views, PDF and ePub downloads, according to the available data) and Abstracts Views on Vision4Press platform.
Data correspond to usage on the plateform after 2015. The current usage metrics is available 48-96 hours after online publication and is updated daily on week days.
Initial download of the metrics may take a while.