Fig. B.1
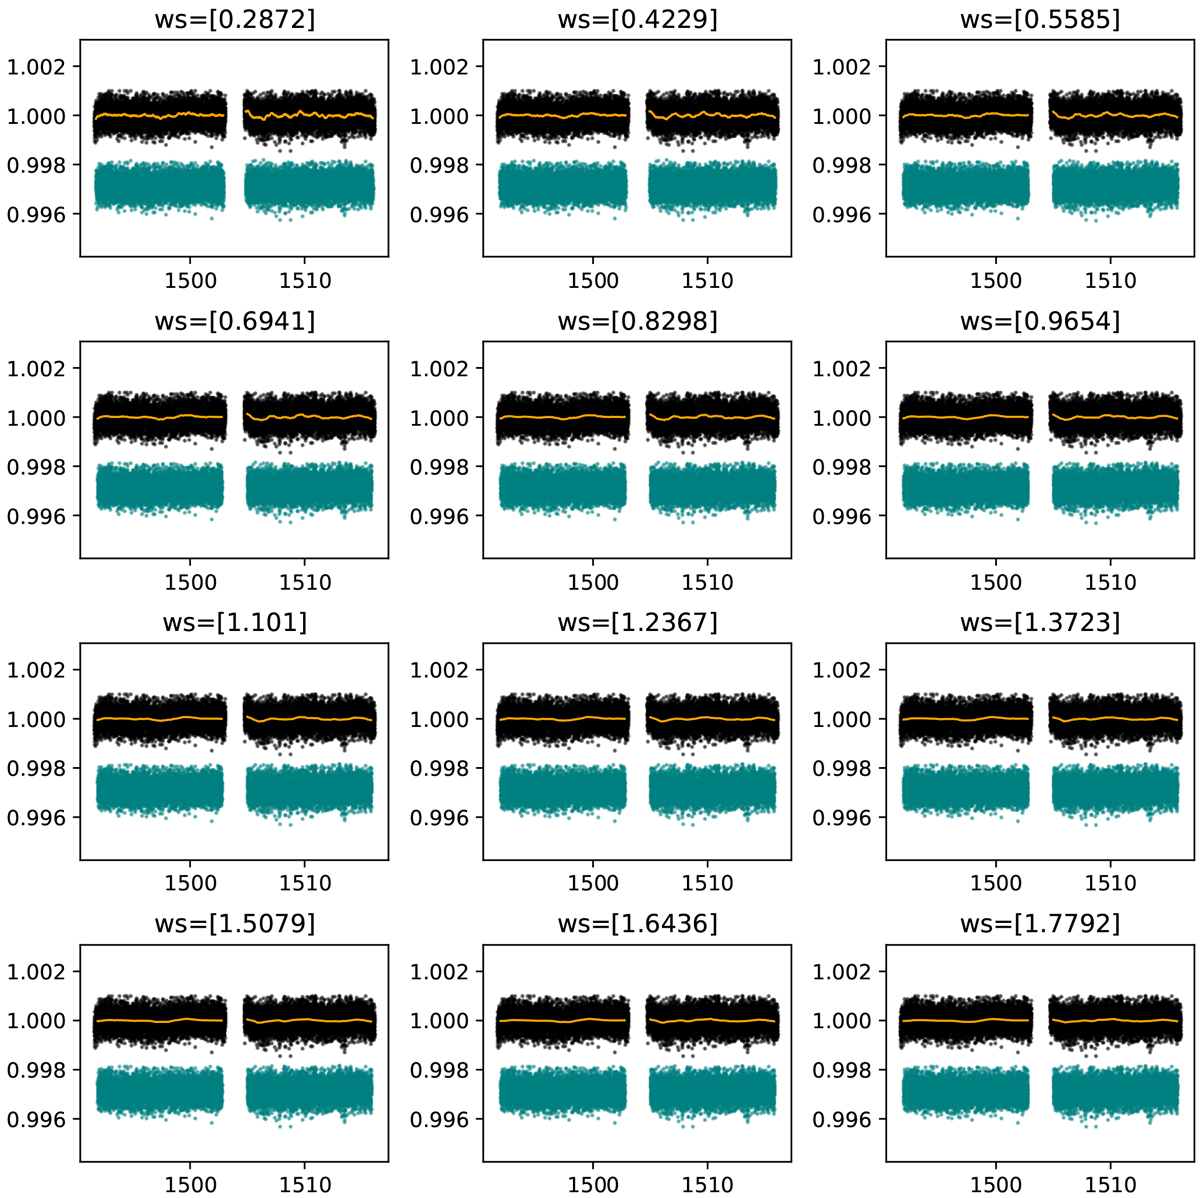
Detrended models applied to the TESS data in our search for threshold-crossing events. We used the bi-weight method with different window-sizes. Each panel indicates the window-size (in units of d) in the top. The black points show the PDC-SAP fluxes, the solid-orange line are the identified trends, and the teal points are the detrended data used as input into the TLS. In all cases, the y-axis shows the normalised flux, and the x-axis is units of Barycentric TESS Julian Date.
Current usage metrics show cumulative count of Article Views (full-text article views including HTML views, PDF and ePub downloads, according to the available data) and Abstracts Views on Vision4Press platform.
Data correspond to usage on the plateform after 2015. The current usage metrics is available 48-96 hours after online publication and is updated daily on week days.
Initial download of the metrics may take a while.