Fig. 1
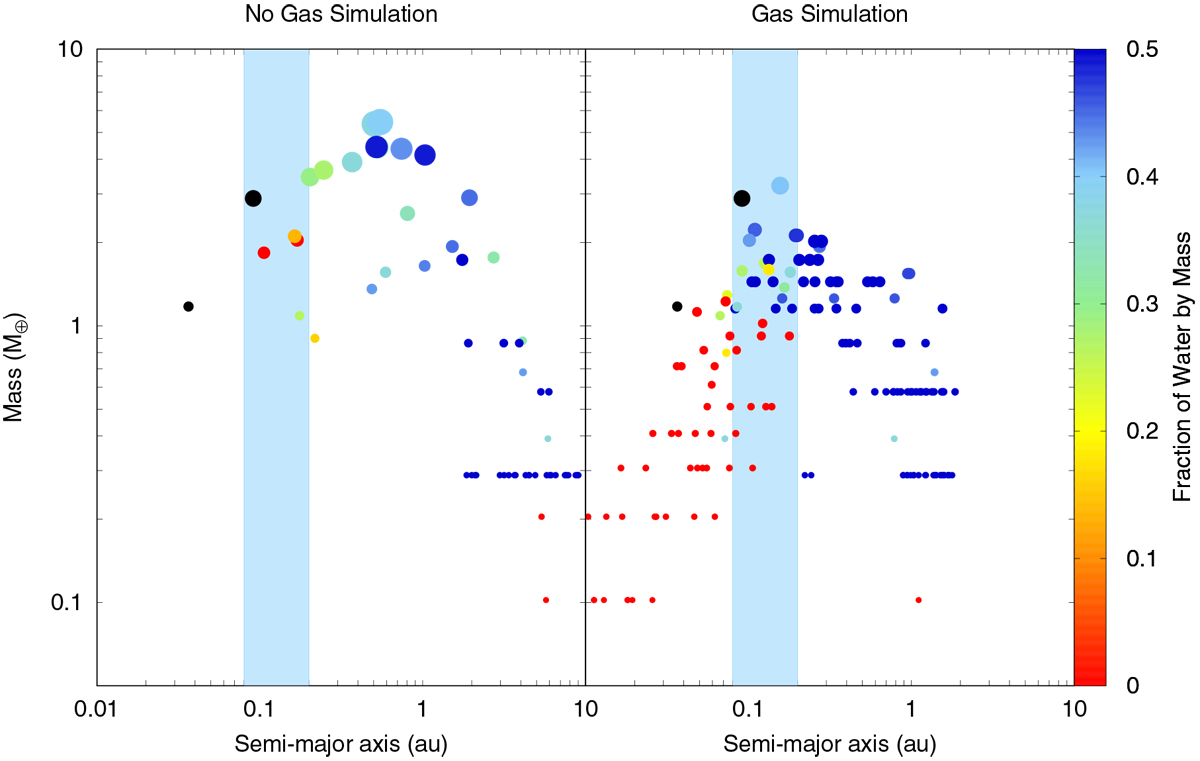
Mass distribution of the planets formed in the N-body simulations after 100 Myr of Set 1 (left panel), which only model the post-gas stage, and Set 2 (right panel), which include the effects of the gas disk. In every panel, the black circles illustrate the two planets confirmed that orbit GJ 273 (Astudillo-Defru et al. 2017b), while the color code represents the final fraction of water by mass of the planets resulting from our numerical experiments. Finally, the light blue shaded region refers to the optimistic HZ derived from the model developed by Kopparapu et al. (2013a,b).
Current usage metrics show cumulative count of Article Views (full-text article views including HTML views, PDF and ePub downloads, according to the available data) and Abstracts Views on Vision4Press platform.
Data correspond to usage on the plateform after 2015. The current usage metrics is available 48-96 hours after online publication and is updated daily on week days.
Initial download of the metrics may take a while.