Free Access
Fig. 7.
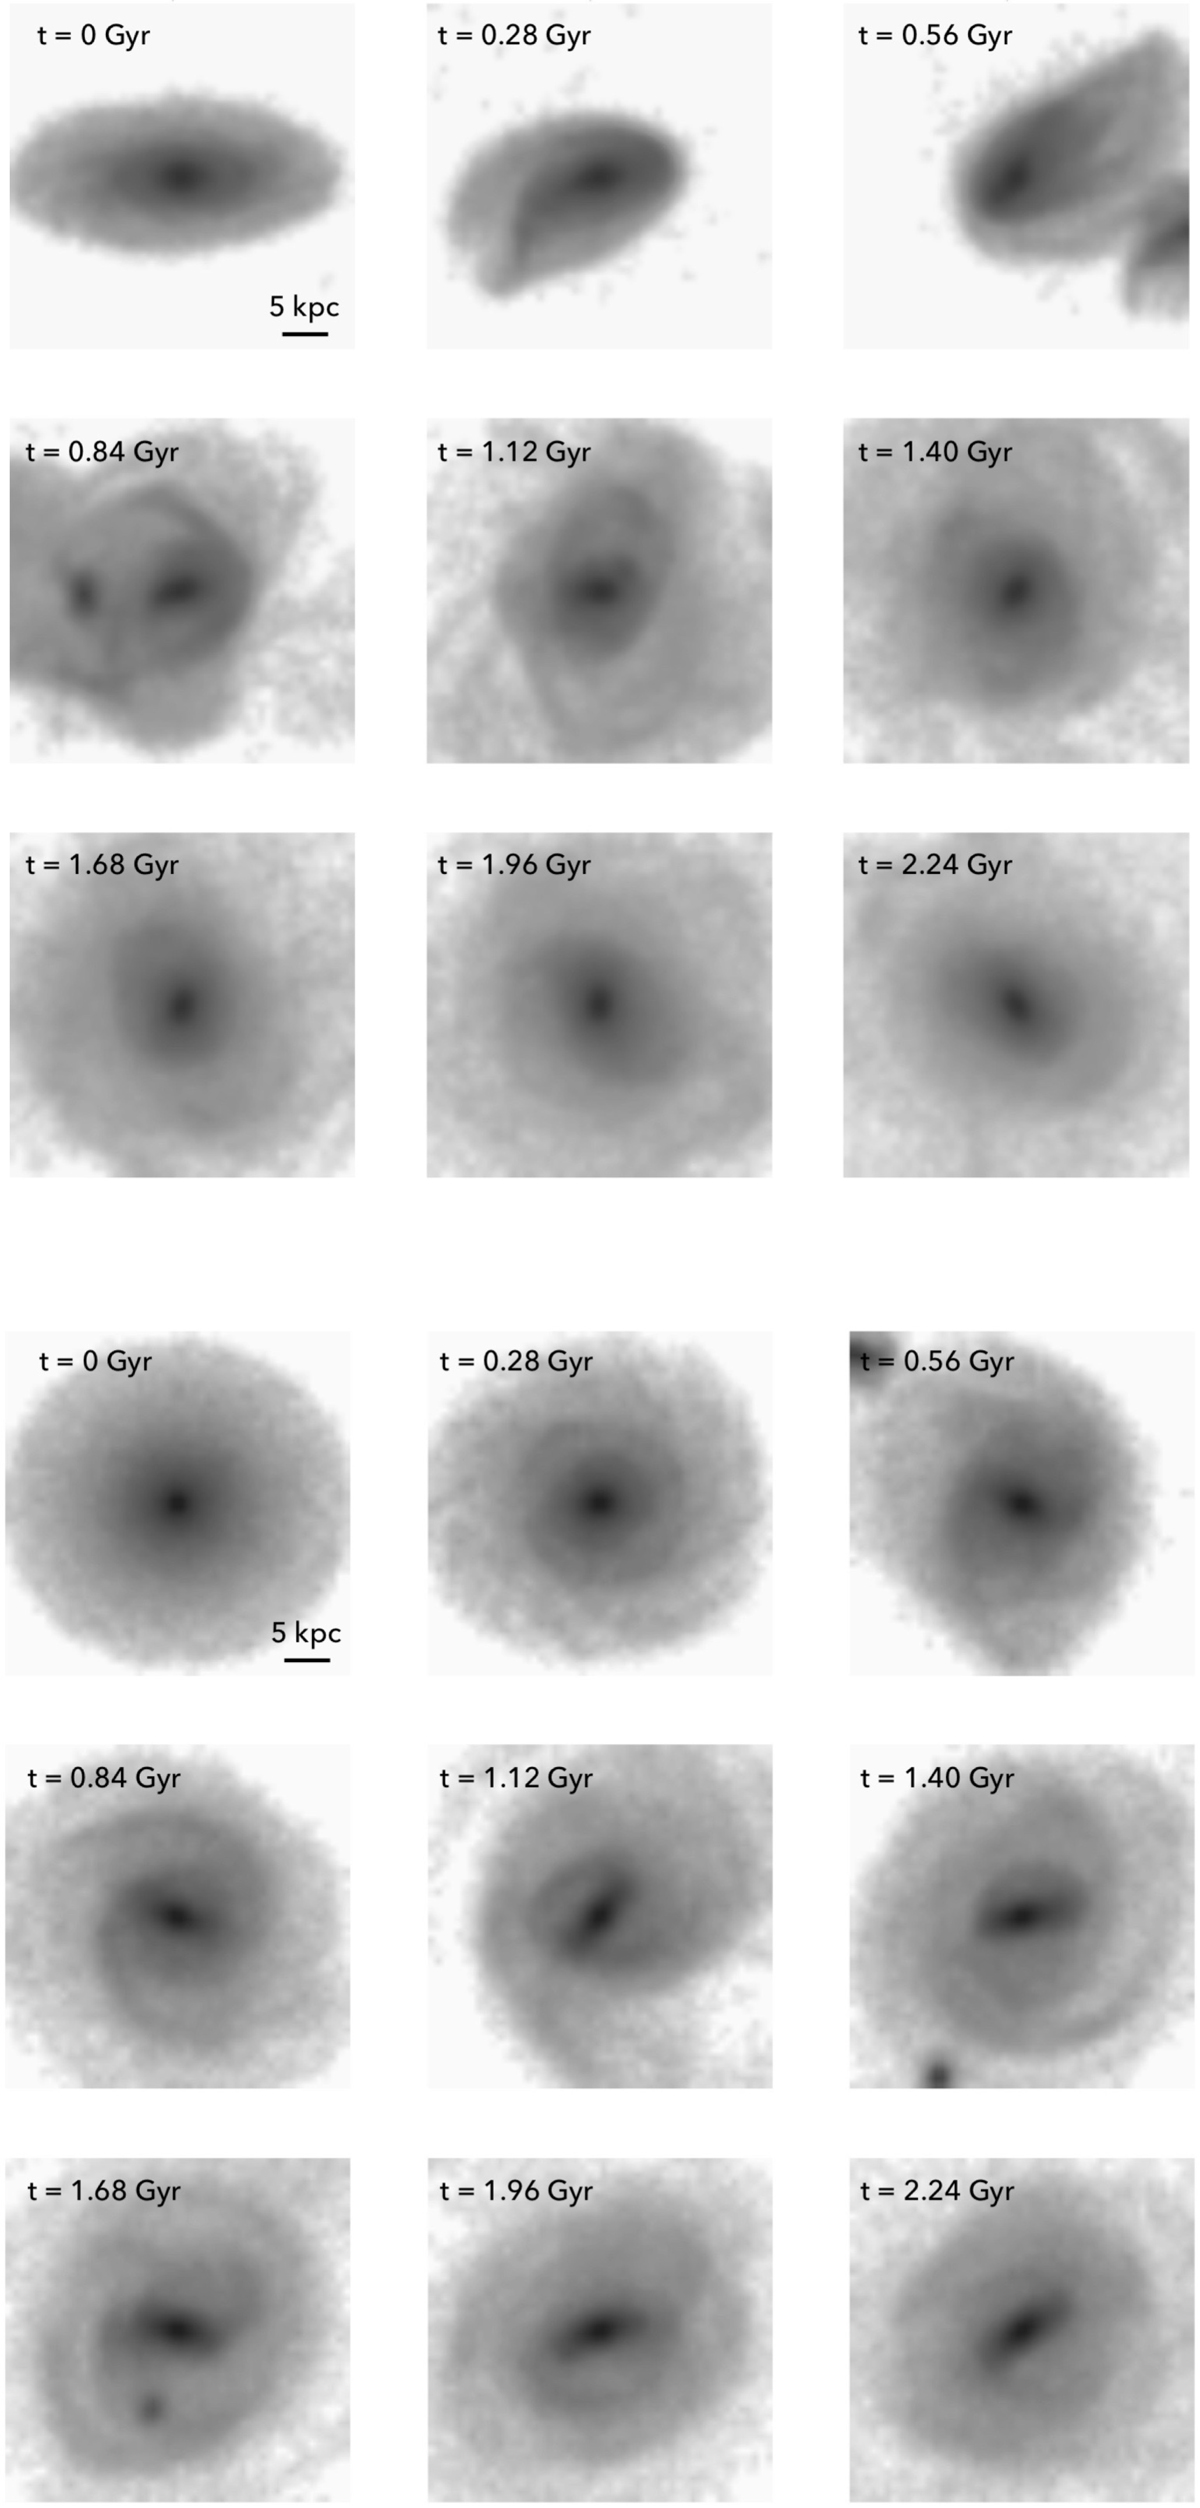
Time evolution of the 2D normalised mass density distribution (x–y plane projection) for a major merger with mass ratio m2 = 1.0 (top) and minor merger with mass ratio m2 = 0.1 (bottom) for the small-bulge m1 model. Each frame measures 35 kpc by 35 kpc (these dimensions are used throughout) and each timestep is 240 Myr.
Current usage metrics show cumulative count of Article Views (full-text article views including HTML views, PDF and ePub downloads, according to the available data) and Abstracts Views on Vision4Press platform.
Data correspond to usage on the plateform after 2015. The current usage metrics is available 48-96 hours after online publication and is updated daily on week days.
Initial download of the metrics may take a while.