Fig. 4.
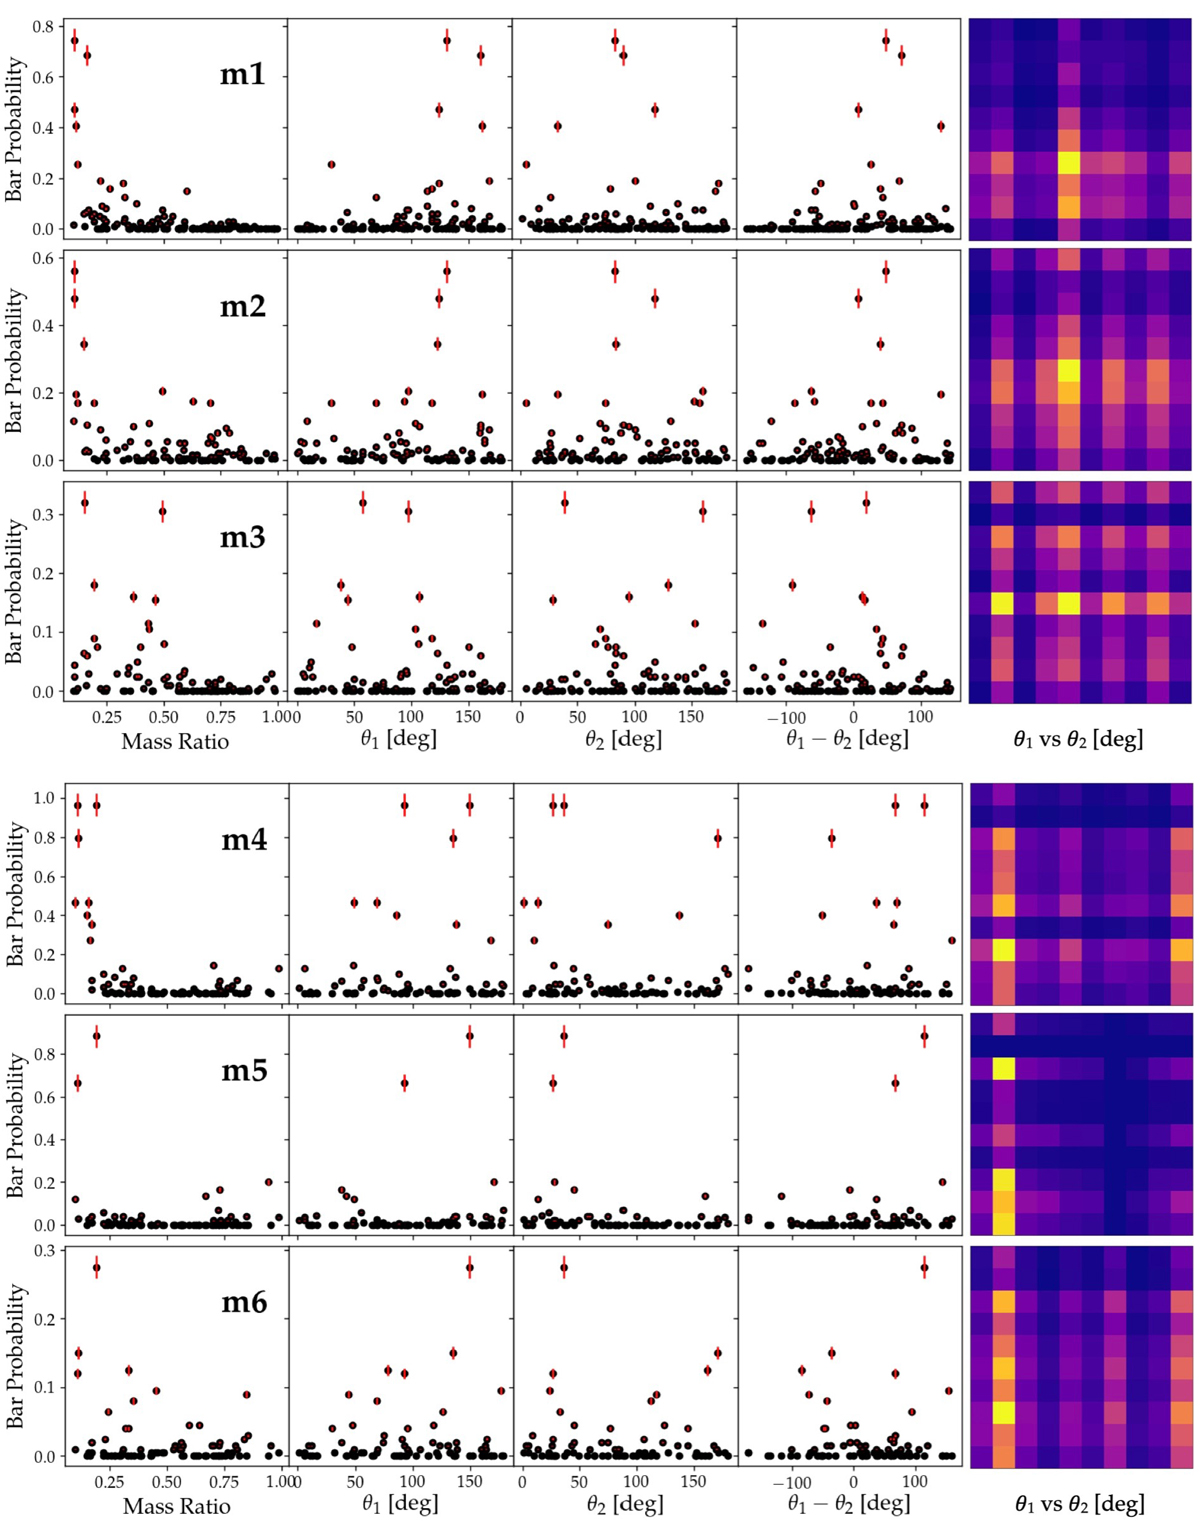
Incidence of bar formation, expressed as the bar fraction fbar or bar probability, as a function of mass ratio m2, the difference in spin angle θ1, θ2, and as a function of θ1 vs. θ2 where θ1 is on the vertical axis. Lighter shades in the normalised density map of θ1 vs. θ2 indicate a higher relative probability of bar detection. Error bars indicate one standard error σ.
Current usage metrics show cumulative count of Article Views (full-text article views including HTML views, PDF and ePub downloads, according to the available data) and Abstracts Views on Vision4Press platform.
Data correspond to usage on the plateform after 2015. The current usage metrics is available 48-96 hours after online publication and is updated daily on week days.
Initial download of the metrics may take a while.