Fig. 1.
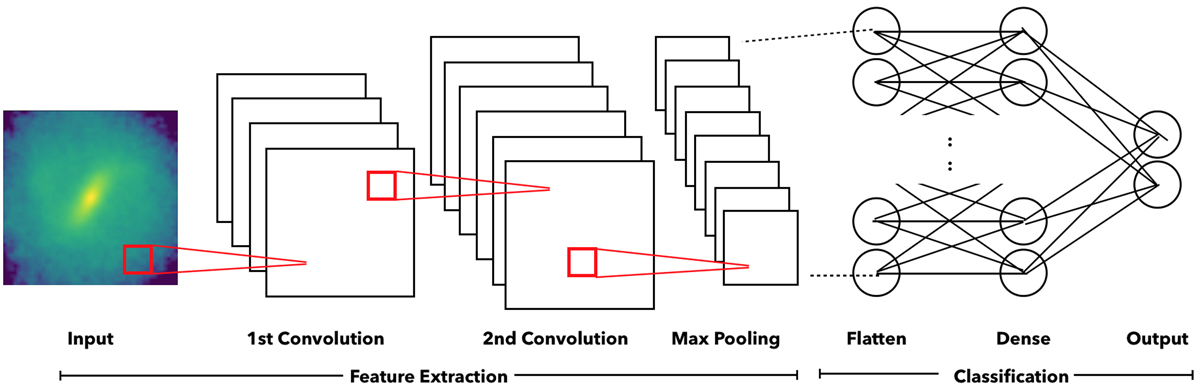
Schematic overview of the general architecture of a convolutional neural network. The input image is mapped into various feature maps via convolutions, followed by a pooling layer that performs local averaging and sub-sampling. The final layer is a list of outputs that, in our case, correspond to whether a bar is present or not.
Current usage metrics show cumulative count of Article Views (full-text article views including HTML views, PDF and ePub downloads, according to the available data) and Abstracts Views on Vision4Press platform.
Data correspond to usage on the plateform after 2015. The current usage metrics is available 48-96 hours after online publication and is updated daily on week days.
Initial download of the metrics may take a while.