Fig. 8
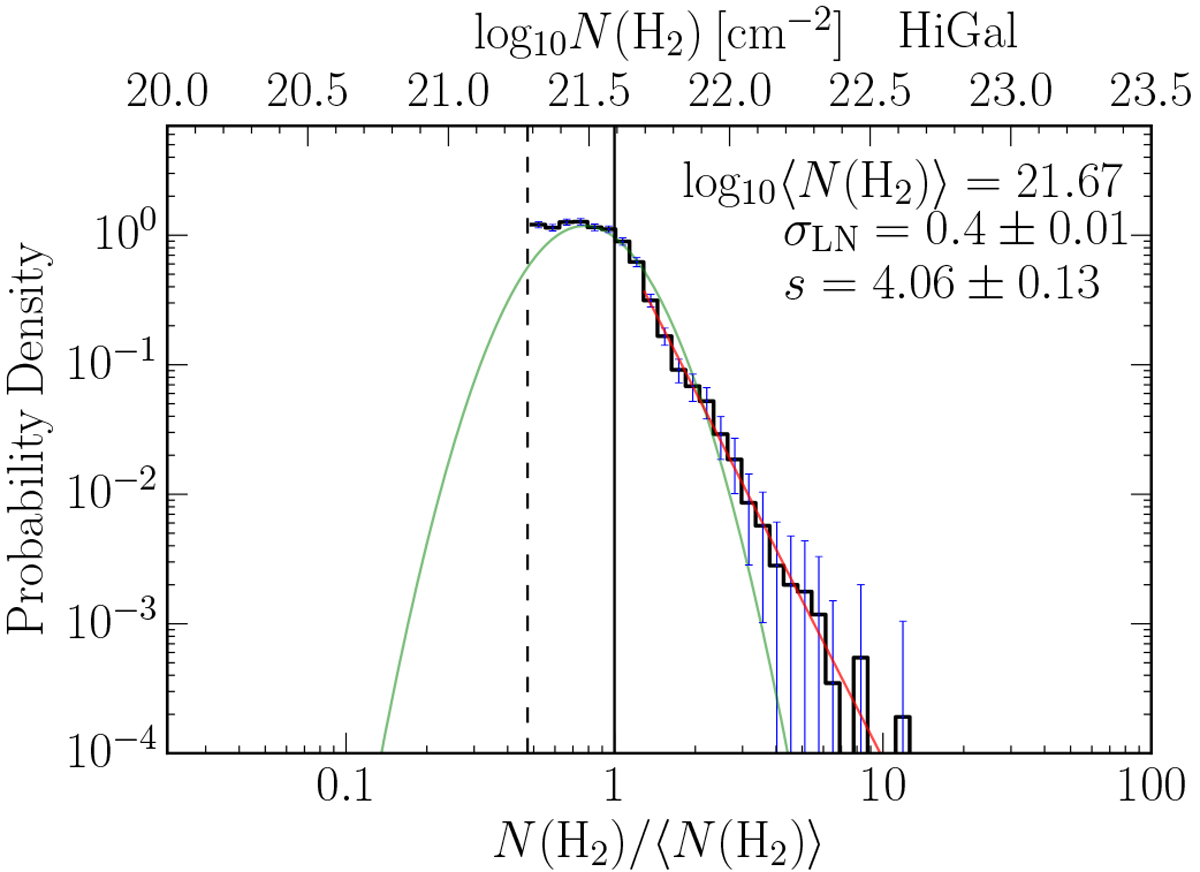
Probability density functions of the molecular hydrogen column density derived from Hi-GAL (Fig. 2). The dashed vertical line marks the column density threshold, and the solid vertical line marks the mean column density. We list in the figure the mean column density ⟨N(H2)⟩, the log-normal (green curve) width σLN, and the power-law index s (solid line). Error bars are calculated from Poisson statistics.
Current usage metrics show cumulative count of Article Views (full-text article views including HTML views, PDF and ePub downloads, according to the available data) and Abstracts Views on Vision4Press platform.
Data correspond to usage on the plateform after 2015. The current usage metrics is available 48-96 hours after online publication and is updated daily on week days.
Initial download of the metrics may take a while.