Fig. 7
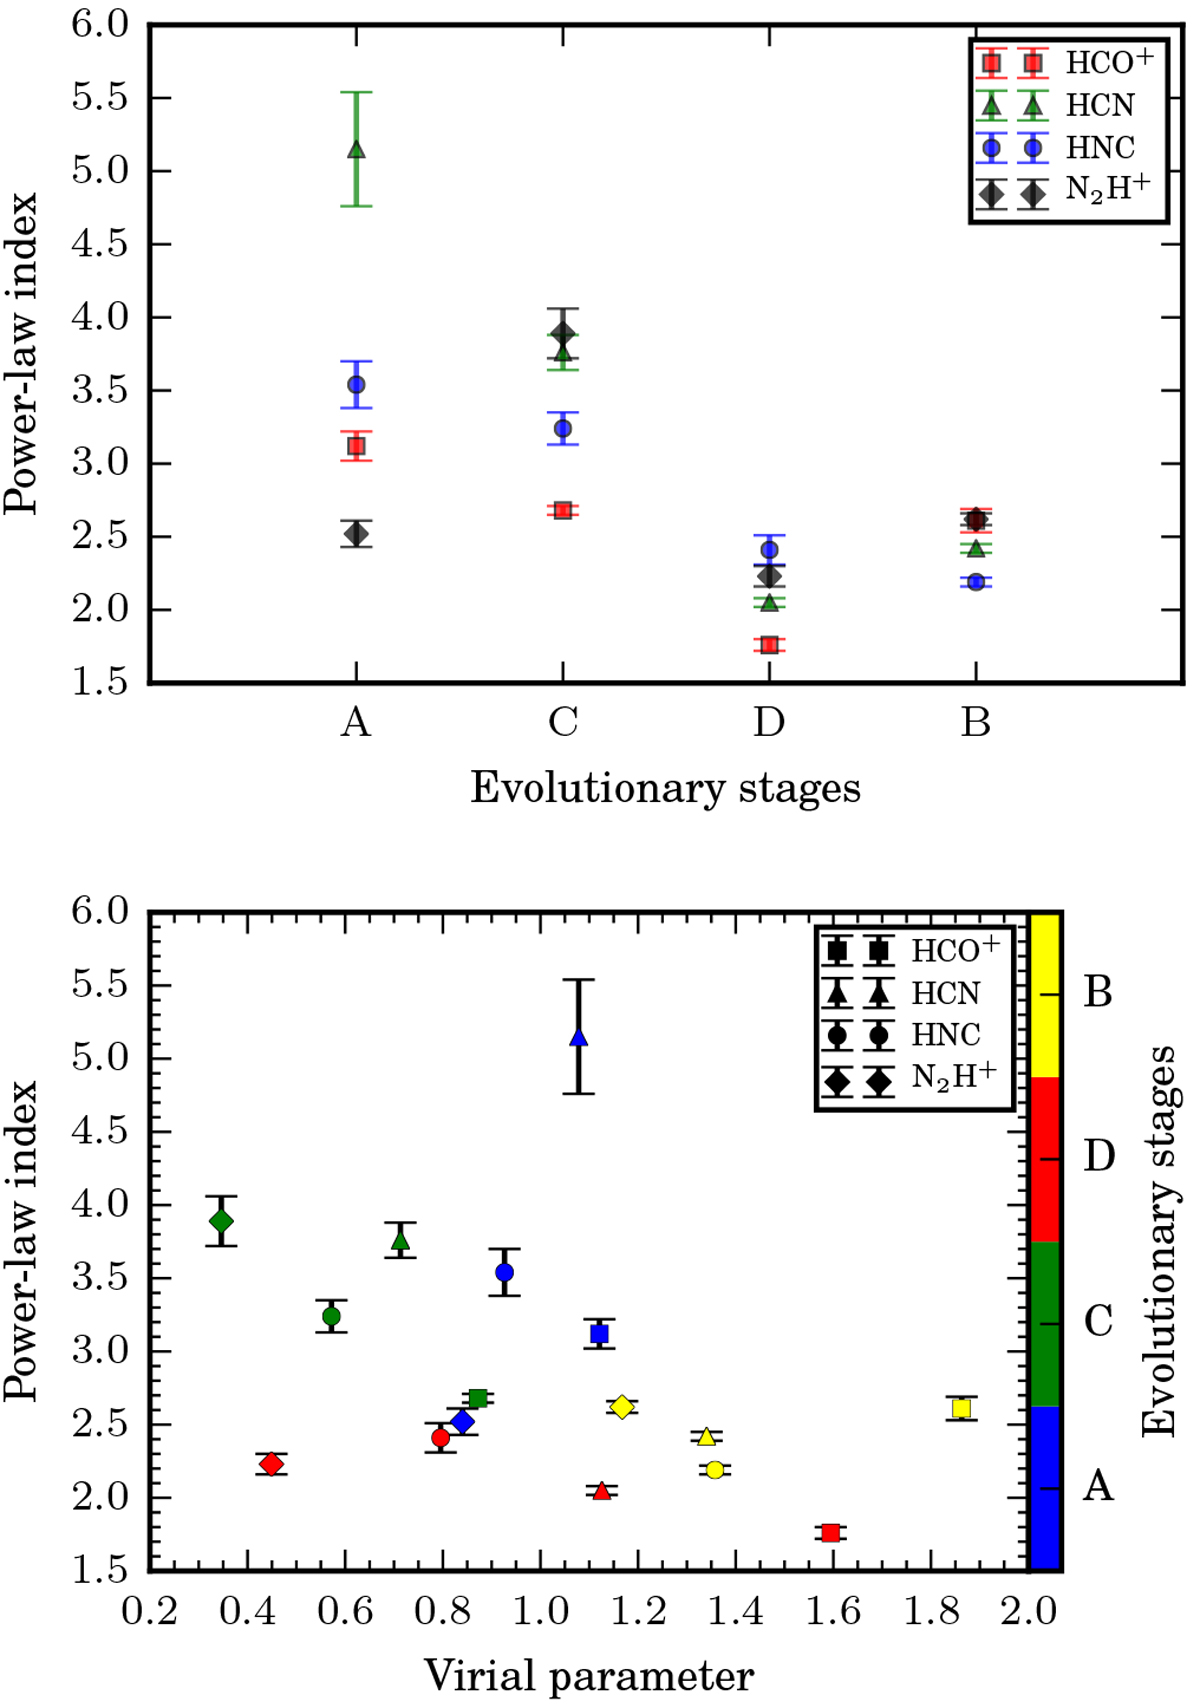
Power-law indices of the N-PDFs plotted as a function of the evolutionary stages (top panel) and of the virial parameter (bottom panel) the sub-regions. The data points in the bottom panel are colored according to the sub-regions and evolutionary stages: Regions A and C are at a relatively early and quiescent stage, Region D is more evolved with an HCH II region, and Region B is the most evolved region with PDRs.
Current usage metrics show cumulative count of Article Views (full-text article views including HTML views, PDF and ePub downloads, according to the available data) and Abstracts Views on Vision4Press platform.
Data correspond to usage on the plateform after 2015. The current usage metrics is available 48-96 hours after online publication and is updated daily on week days.
Initial download of the metrics may take a while.