Fig. 5
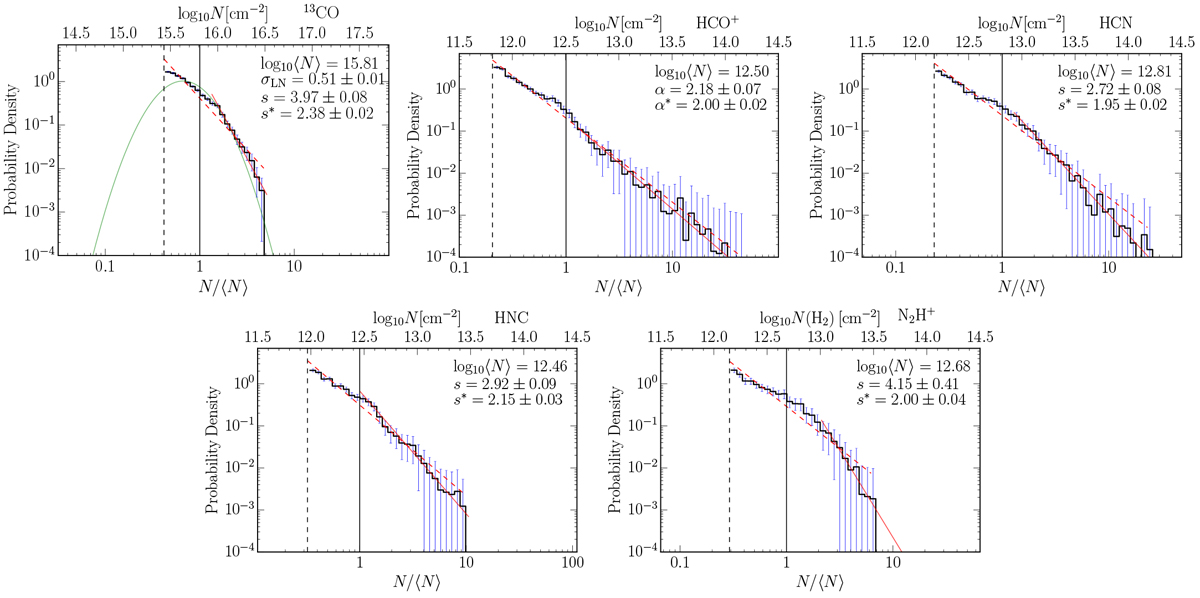
Probability density functions of the 13CO, HCO+, HCN, HNC, and N2H+ column density for the whole filament. The dashed vertical lines in each panel mark the column density threshold (5σ level), and the solid vertical lines mark the mean column densities. We list in each panel the mean column density ⟨N⟩, the power-law index s (the optimized fit, solid line), and s* (the fit to all data, dashed line). For the 13CO N-PDF, we also list the log-normal width σLN. Error bars are calculated from Poisson statistics.
Current usage metrics show cumulative count of Article Views (full-text article views including HTML views, PDF and ePub downloads, according to the available data) and Abstracts Views on Vision4Press platform.
Data correspond to usage on the plateform after 2015. The current usage metrics is available 48-96 hours after online publication and is updated daily on week days.
Initial download of the metrics may take a while.