Fig. 4
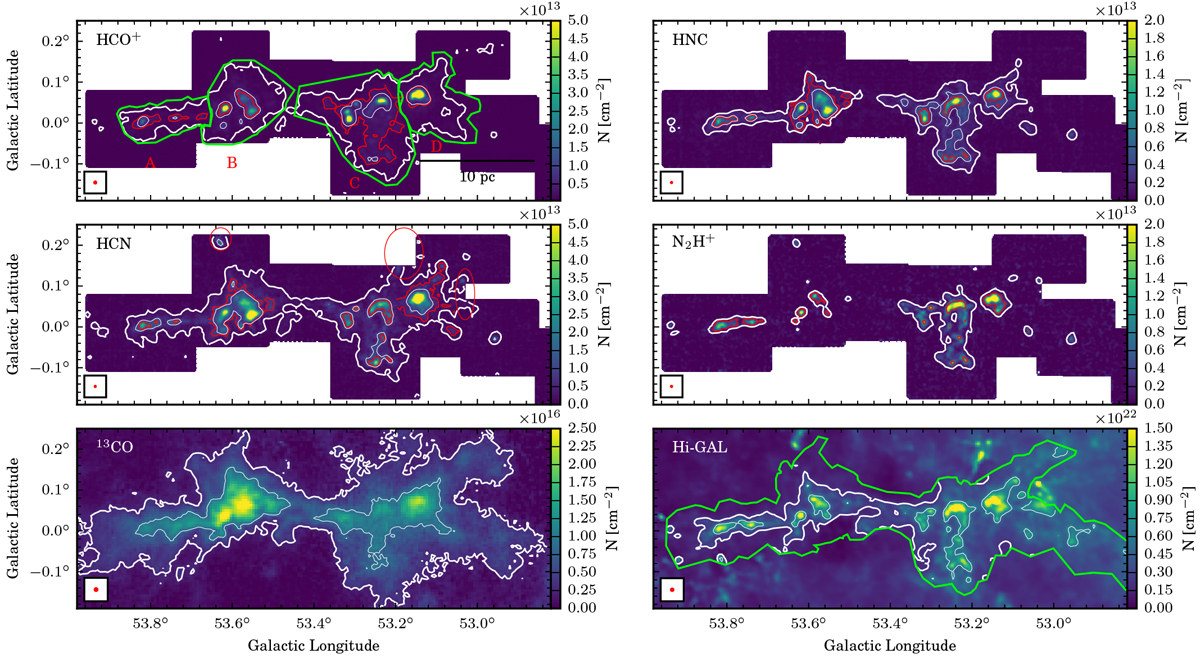
Column density maps of HCO+, HCN, 13CO, HNC, and N2H+, and molecular hydrogen column density map derived from Hi-GAL dust continuum emission. The thick white contours in each panel outline the column densities we used to construct the N-PDFs, and the thin white contours mark the optimal column density threshold (Nmin for the optimal power-law fit) for the whole filament. The red contours in the dense gas molecular line panels mark Nmin for the power law for the sub-regions (see Sect. 3.3). The green polygon in the Hi-GAL panel outlines the area we used to construct the N-PDFs from the dense gas tracers and continuum emission in the following sections. The beam of the column density maps (43′′ for Hi-GAL, 46′′ for 13CO, and 32′′ for the other panels) is marked in the bottom left of each panel. The polygons in the HCO+ panel and ellipses in the HCN panel are the same as in Fig. 2.
Current usage metrics show cumulative count of Article Views (full-text article views including HTML views, PDF and ePub downloads, according to the available data) and Abstracts Views on Vision4Press platform.
Data correspond to usage on the plateform after 2015. The current usage metrics is available 48-96 hours after online publication and is updated daily on week days.
Initial download of the metrics may take a while.